
AI Dashcams vs. Risky Driving: The 7 Highest-Risk Behaviours AI Dashcams Catch (and How to Coach Them)

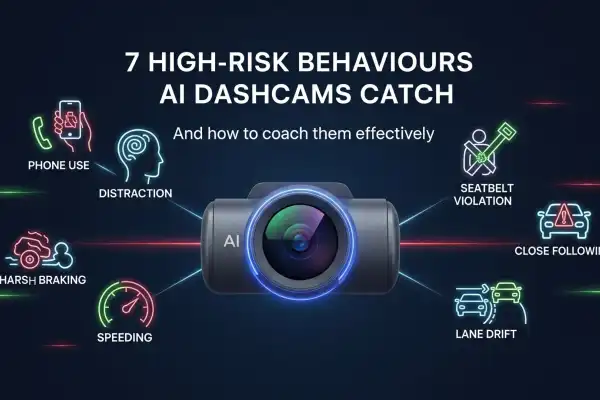
The 7 highest-risk behaviours AI dashcams catch (what to measure & why)
1. Distraction (eyes off road / cognitive distraction)
Detection: driver-facing camera + head-pose, gaze, blink-rate algorithms; telemetry to rule out intentional glances (e.g., map checks while stopped).
Why it matters: distraction is strongly correlated with crashes and near-misses. Use immediate in-cab auditory/vibration alerts for first occurrences, then escalate.
2. Phone use (handheld calls, texting)
Detection: driver camera + object classification (phone), hands-on-wheel sensor, and correlation with glance behavior.
Coaching trigger: 2 in-cab alerts in 7 days → mandatory 1:1 coaching. Industry reports show in-cab alerts significantly increase detection and correction.
3. Seatbelt non-use
Detection: seat-sensor + vision-based confirmation.
Intervention: soft in-cab reminders (first 3 occurrences), then supervisor notification and retraining for repeat offenders. Enhanced seatbelt reminders have measurable uptake in studies.
4. Harsh braking / aggressive deceleration
Detection: accelerometer thresholds (g-force) + video context to eliminate legitimate emergency braking.
Coaching: show short clips of events, coach on anticipation & safe following distances. Harsh events predict elevated crash risk.
5. Speeding (sustained or repeated over-limit events)
Detection: GPS speed vs posted speed data (map + speed limit source) and over-limit duration.
Program: geo-fenced speed policies + in-cab reminders reduce infractions quickly when paired with analytics.
6. Close following / tailgating
Detection: forward gap estimation from camera + radar (if available) or time-headway heuristics using speed and relative motion.
Coach: teach safe headway; escalate repeat tailgating to formal review. Research & vendor case studies list close following as high-priority behavior to eliminate.
7. Lane drift / poor lane discipline
Detection: lane-position tracking from forward camera (lane markings), yaw rate drift, and steering inputs.
Coaching: targeted lane-discipline drills, simulator or supervised on-road correction sessions.
How to structure a coaching program (playbook + 14-day pilot example)
Pilot design (3 drivers, 14 days)
Day −7 to 0 — Baseline collection
Collect 7 days of telemetry: risky minutes, alerts, km driven, event clips. No coaching, only logging.
Day 1 — Kickoff & expectations
Quick 15-minute briefing: goals, what's being measured, privacy & fairness rules.
Day 1–14 — Active coaching
- Real-time in-cab alerts: immediate notification to driver.
- Weekly one-page report (end of day 7, day 14): clips, top 3 behaviours, actionable tips (max 3 items).
- 1:1 coaching call after day 7: review clips (≤5 minutes), set two behaviour goals for next week.
- Positive reinforcement: recognition for improvement (e.g., "safety streak" certificates).
Day 15 — Review & scale
Assess % reduction vs baseline, look for false positives, iterate thresholds.
Sample pilot example (anonymized)
| Metric | Baseline (7 days) | After 14 days | Improvement |
|---|---|---|---|
| Driver A — Risky minutes per 100 km | 18 | 9 | 50% reduction |
| Driver A — Alerts per 1,000 km | 12 | 6 | 50% reduction |
Note: example figures above are illustrative. Measure with your telemetry and report exact numbers.
KPI workbook (what to measure & how to compute)
| Metric | Definition | Formula | Target (example) |
|---|---|---|---|
| Risky minutes per 100 km | Total minutes spent in flagged risky state per 100 km travelled | (Sum risky minutes / total km) × 100 | Reduce by 40% in 90 days |
| Alerts per 1,000 km | Count of alerts / (total km / 1000) | (Total alerts) / (total km / 1000) | < 10 alerts / 1,000 km |
| Alert-to-ack time | Median seconds between alert and driver/control-room acknowledgement | median(ack_time - alert_time) | < 60 s |
| Repeat offender rate | % drivers with >2 distinct coaching events in 30 days | drivers_repeat / total_drivers × 100 | < 5% |
| False positive rate | % flagged events reviewed as non-risk | fp_events / total_events × 100 | < 10% |
Benchmarks & evidence (what the literature and case studies show)
Vendor & Case Studies
Vendor & case studies show large, fleet-specific reductions: sample published results include claim reductions of ~21% (Lytx / RSA case) and fleet accident reductions up to ~67% in some deployments. Case outcomes vary by fleet size, baseline risk, and program discipline.
Empirical Studies
Empirical studies and program reviews indicate driver coaching paired with telematics reduces accident frequency materially — one review found average reductions in the 28–49% range for coached groups in some programs.
Broad Telematics Surveys
Broad telematics surveys report ~72% of fleets see crash/claim reductions when telemetry is combined with driver training and intervention workflows.
Interpretation
How to interpret these numbers: vendor case studies are useful directional signals; your fleet results will depend on baseline behaviour, data quality, coaching fidelity, and management follow-through.
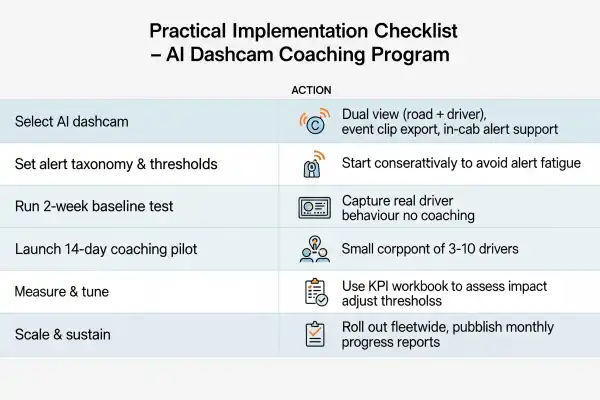
Practical implementation checklist
Setup Phase
- Select AI dashcam with dual view (road + driver), event clip export, and in-cab alert support.
- Set up an alert taxonomy and initial thresholds (conservative to avoid alert fatigue).
- Run a 2-week baseline test to capture real behaviour.
Launch Phase
- Launch a 14-day coaching pilot for a small cohort (3–10 drivers).
- Use KPI workbook to measure impact and tune thresholds.
- Scale to the whole fleet, maintain privacy and human review, and publish monthly progress reports.
FAQ
Download the redacted coaching playbook + KPI workbook
Get our comprehensive resources for implementing AI dashcam coaching programs in your fleet.
📋 Download Coaching Playbook (PDF)