
Transport Management Systems with AI-Powered Analytics and Reporting

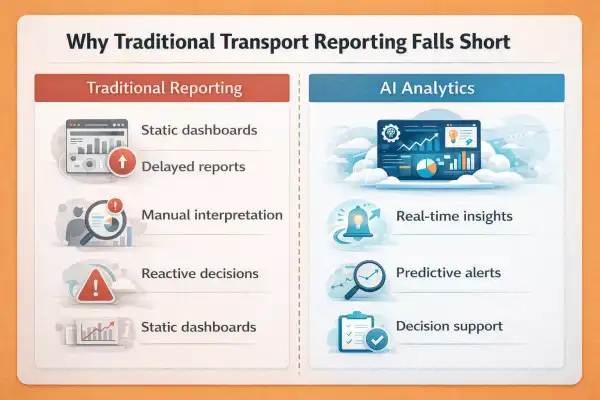
Why Traditional Transport Reporting Falls Short
Most transport operations already generate reports. Yet many logistics managers still rely on intuition when making decisions.
The problem is not a lack of data — it is the way data is presented.
Static Dashboards
Traditional transport reporting typically relies on fixed dashboards showing metrics such as:
- Completed trips
- Delivery timelines
- Fuel consumption totals
- Vehicle utilisation
While useful for record-keeping, static dashboards rarely explain operational behaviour.
They answer: What happened?
But not: Why did it happen?
Lagging Indicators
Conventional reports are retrospective. They arrive after operations are completed.
By the time insights appear:
- Delays have already occurred
- Fuel inefficiencies are already incurred
- Compliance risks may already exist
This makes reporting reactive rather than preventive.
No Decision Support
Traditional systems present numbers without context.
Managers must manually interpret:
- Which routes underperformed
- Which drivers caused delays
- Whether inefficiencies are recurring patterns
This increases cognitive load and slows decision-making.
What AI-Powered Analytics in Transport Management Really Means
AI analytics is often misunderstood as a buzzword. In transport management, its role is practical rather than futuristic.
It focuses on recognising patterns within operational data that humans cannot easily detect at scale.
Pattern Detection
AI systems analyse large datasets across:
- Trips
- Routes
- Vehicles
- Driver behaviour
- Delivery outcomes
Over time, they identify recurring trends such as:
- Consistently delayed routes
- High fuel consumption corridors
- Performance variations across regions
These patterns enable proactive optimisation.
Anomaly Alerts
Instead of waiting for manual review, AI detects unusual behaviour automatically.
Examples include:
- Unexpected route deviations
- Sudden idle-time spikes
- Unusual fuel usage patterns
Alerts allow operations teams to intervene early rather than diagnose issues later.
Predictive Insights
Advanced analytics move beyond monitoring into forecasting.
AI models can estimate:
- Probability of delivery delays
- Route risk levels
- Maintenance likelihood
- Operational bottlenecks
This shifts transport management from reactive control to predictive planning.
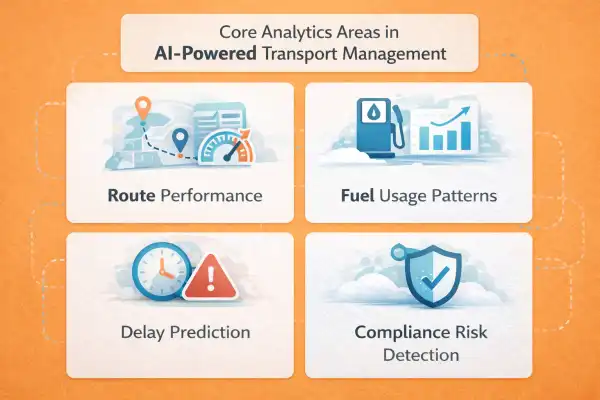
Core Analytics Areas Enabled by AI in TMS
AI analytics creates value across several operational layers.
Route Performance Analysis
AI evaluates:
- Planned vs actual route execution
- Time variance patterns
- Recurring bottlenecks
Instead of isolated incidents, teams see systemic inefficiencies.
Fuel Usage Patterns
Rather than viewing fuel totals alone, AI identifies:
- Routes with abnormal consumption
- Idle-time contributors
- Behavioural patterns affecting efficiency
Fuel optimisation becomes evidence-based rather than assumption-driven.
Delay Prediction
By analysing historical trends and live signals, AI can flag deliveries at risk before delays occur.
This enables:
- Proactive customer communication
- Dynamic operational adjustments
- Improved service reliability
Compliance Risk Detection
AI analytics can highlight:
- Driving pattern risks
- Regulatory deviations
- Operational anomalies affecting compliance
Early detection reduces exposure to penalties and operational disruption.
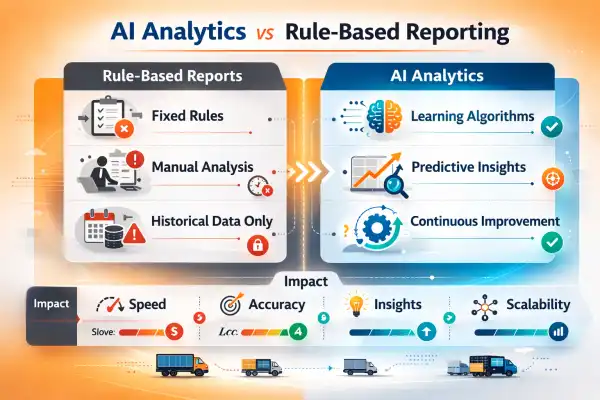
AI Analytics vs Rule-Based Reports
Many transport systems already include rule-based reporting. Understanding the difference is essential.
| Aspect | Rule-Based Reporting | AI Analytics |
|---|---|---|
| Logic | Predefined rules | Learns from data |
| Adaptability | Fixed | Improves over time |
| Insight Type | Descriptive | Predictive |
| Decision Support | Limited | Context-aware |
| Scalability | Manual expansion | Automated learning |
Rule-based reports answer known questions.
AI analytics reveals unknown problems.
How AI Analytics Helps Reduce Operational Blind Spots
As transport networks scale, visibility gaps increase.
AI analytics reduces these blind spots by making hidden relationships visible.
What Managers Stop Guessing
- Which routes truly cause delays
- Which operational changes improve efficiency
- Where costs actually originate
Decisions shift from intuition to evidence.
What Becomes Measurable
AI transforms previously abstract concepts into measurable metrics:
- Operational consistency
- Route reliability
- Predictive performance trends
- Risk probability
This clarity improves planning confidence.
Common Misconceptions About AI in Transport Software
AI ≠ Automation Alone
Automation executes predefined tasks.
AI analytics:
- Learns patterns
- Generates insights
- Improves recommendations over time
Automation performs actions; AI improves understanding.
AI ≠ Black Box Technology
Modern AI analytics platforms emphasise transparency through:
- Explainable insights
- Visualised trends
- Interpretable recommendations
The goal is operational clarity, not complexity.
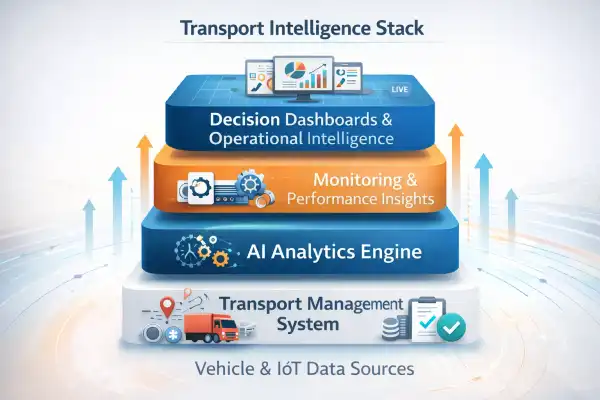
Where AI Analytics Fits in the Transport Intelligence Stack
AI analytics is most effective when integrated into a broader operational ecosystem.
Data Sources
Inputs include:
- Vehicle telematics
- Route planning data
- Delivery events
- Operational logs
The more structured the data foundation, the stronger the insights.
Monitoring Layer
Continuous monitoring validates whether planned outcomes match real-world execution.
This feedback loop is essential for learning systems.
Continuous Improvement Loop
A mature transport intelligence workflow follows:
Plan → Execute → Monitor → Analyse → Improve
AI analytics strengthens the analysis phase, enabling continuous optimisation rather than periodic reviews.
Within modern transport ecosystems — including platforms like Yatis — analytics acts as the connective layer that transforms operational data into actionable intelligence, helping organisations evolve beyond basic transport tracking.
Frequently Asked Questions
Conclusion
AI-powered analytics is often perceived as an advanced feature layered onto transport software. In practice, it serves a far more practical purpose: helping logistics teams understand their operations with clarity.
Traditional reporting tells organisations where they have been. AI analytics helps them understand where inefficiencies originate and how operations can improve continuously.
For growing transport businesses, this shift changes how decisions are made — from reactive problem-solving to proactive optimisation.
Platforms that combine transport execution with analytics and monitoring, such as Yatis, demonstrate how intelligence emerges when operational data is connected rather than isolated. The objective is not complexity or automation for its own sake, but better visibility into everyday operations.
AI analytics is ultimately about clarity, not complexity — enabling transport operations to scale with confidence rather than guesswork.
Ready to get started?
Contact Yatis Telematics to learn how our AI-powered transport management solutions can help your business operate with greater intelligence and efficiency.
Contact Us →