
This article is the 3rd part of the series, where we focus on how driving impacts vehicles and costs of ownership. Earlier articles focused on harsh driving and gear usage and their effect on fuel economy. In this blog, we focus on clutch riding and how to measure it using Yatis OBD IoT device.
What is Clutch Riding
Clutch riding is defined as driving with you clutch pedal somewhere between completely pressed or completely released. Driving with the clutch partially pressed increases the friction on the clutch plate. The increased wear and tear damages the clutch plate and vehicle then needs an expensive part replaced.
A very typical case of clutch riding is when the driver rests his foot on the clutch. He is usually unaware that his foot is pressing the clutch and damaging an expensive part of his vehicle. Other cases of clutch driving occur in slow moving traffic and getting the car moving.
Methodology
When clutch is partially pressed, the clutch plates are not fully engaged, as can be seen in the picture above. It causes some of the energy generated by the engine to be wasted. In terms of RPM and speed, it means that you will need a higher RPM (revolution per minute) to get similar speeds. We measure both RPM and speed with the OBD device. The device sends data to our servers where it is stored and processed.

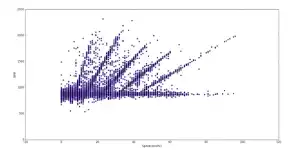
The figure above has a plot RPM versus speed and each of the spoke corresponds a different gear. We apply clustering algorithms on this data and identify these gears.

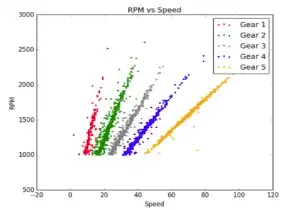
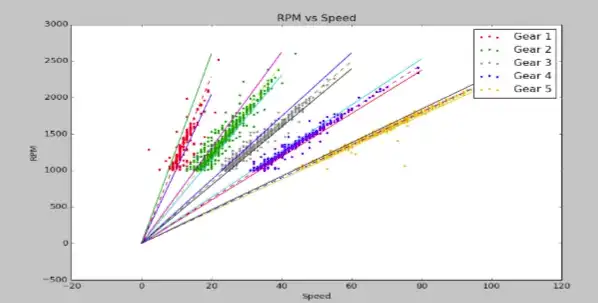
We noticed that a good driver has sharp and crisp spokes, whereas a clutch rider has more blurry spokes. A partially depressed clutch requires more RPM to reach ideal speed, due to which we see more blurriness in the spokes. We defined bounds for each gear and calculated the probability of having points inside the bounds. The better driver will have more points inside the bounds and so will also have a better score. On the other hand, a frequent clutch rider will have less points within the prescribed bounds and a lower score.
The first plot below is from a good driver and a the second plot is from a device installed in a driving school vehicle.


In the second picture the spokes are not as sharp as the first one. It has also more points outside the bounds as compared to the first picture. The driver of the first picture, uses the clutch correctly and has more points within the bounds, as compared to the second driver. The second vehicle was used in a driving school, where the drivers were much less experienced.