Yatis
Yatis is an enterprise IoT solution provider

How to Create Reports in Power BI
This guide provides step-by-step instructions for creating a Power BI report, starting with data preparation in Excel and concluding with data modeling in Power BI.
Getting Data from Excel Sheets
Clean Data in Excel
To ensure seamless integration with Power BI, begin by preparing your data in Excel:
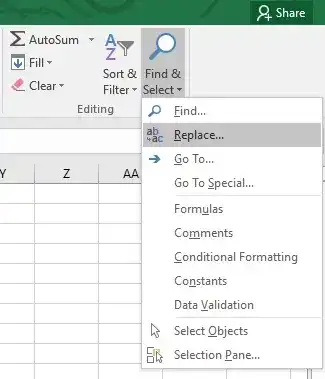
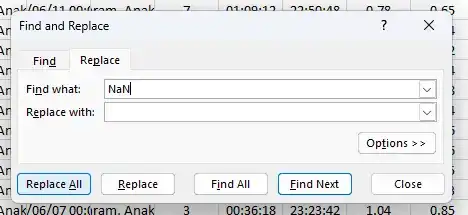
Replace ‘NaN’ Values:
![Replace NaN values screenshot]()
![Replace NaN values screenshot]()
- Review each column in your Excel worksheet for any ‘NaN’ (Not a Number) values.
- Replace these ‘NaN’ values with appropriate substitutes, such as an empty string or a placeholder value. This will help avoid errors when importing data into Power BI.
Remove Unnecessary Rows and Columns:
![Remove unnecessary rows and columns screenshot]()
- Examine your worksheet for rows and columns that do not contribute to your analysis. This includes empty rows, columns with redundant data, or any irrelevant information.
- Delete these unnecessary rows and columns to streamline your data set.


.webp)
Importing Data from Excel Sheet into Power BI
With your data cleaned, you can now import it into Power BI:
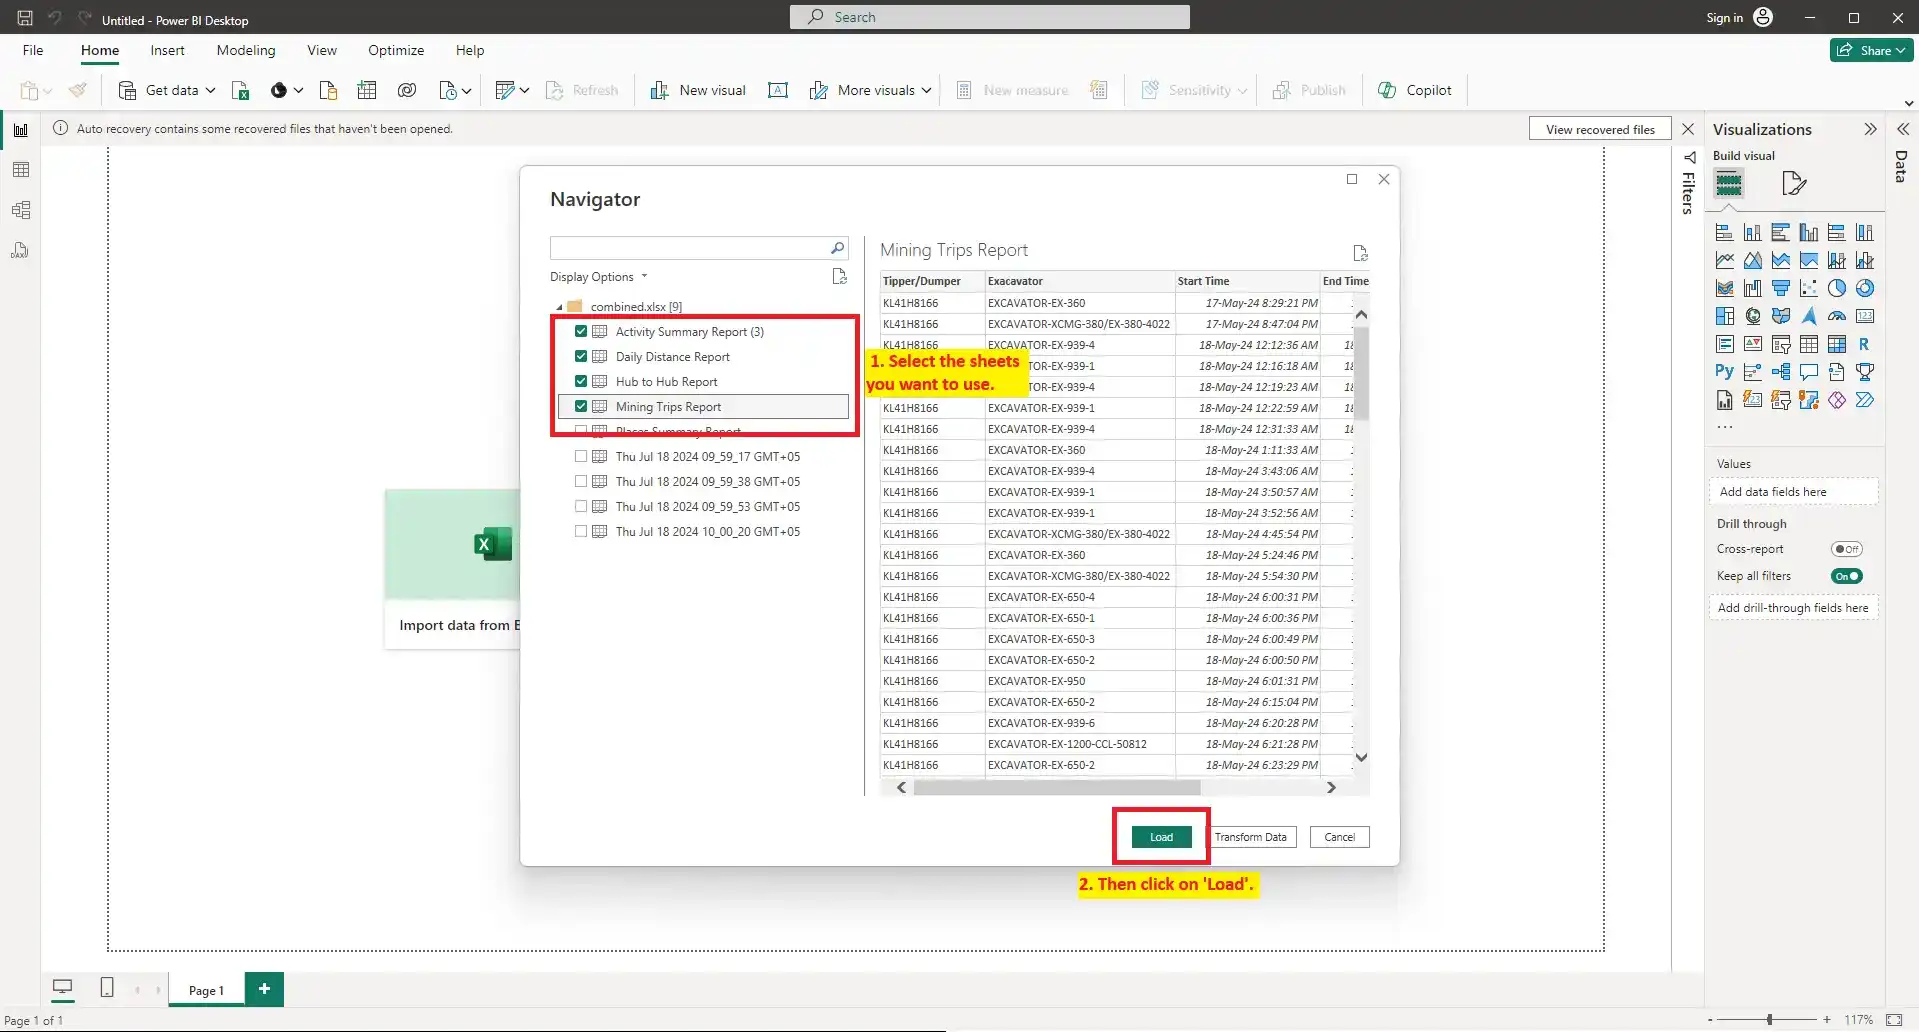
Import Data:
![Import data screenshot]()
- Open Power BI and click on Get Data in the Home tab.
- Select Excel as your data source from the list of available options.
- Locate the folder containing your cleaned Excel files, and open the files you wish to analyze in Power BI.
![Excel data source selection screenshot]()
Data Modeling:
- Once your data is imported, switch to the Modeling view in Power BI.
- If you have data from multiple sheets, you can create relationships between tables by dragging and dropping fields between tables to link them.
.webp)

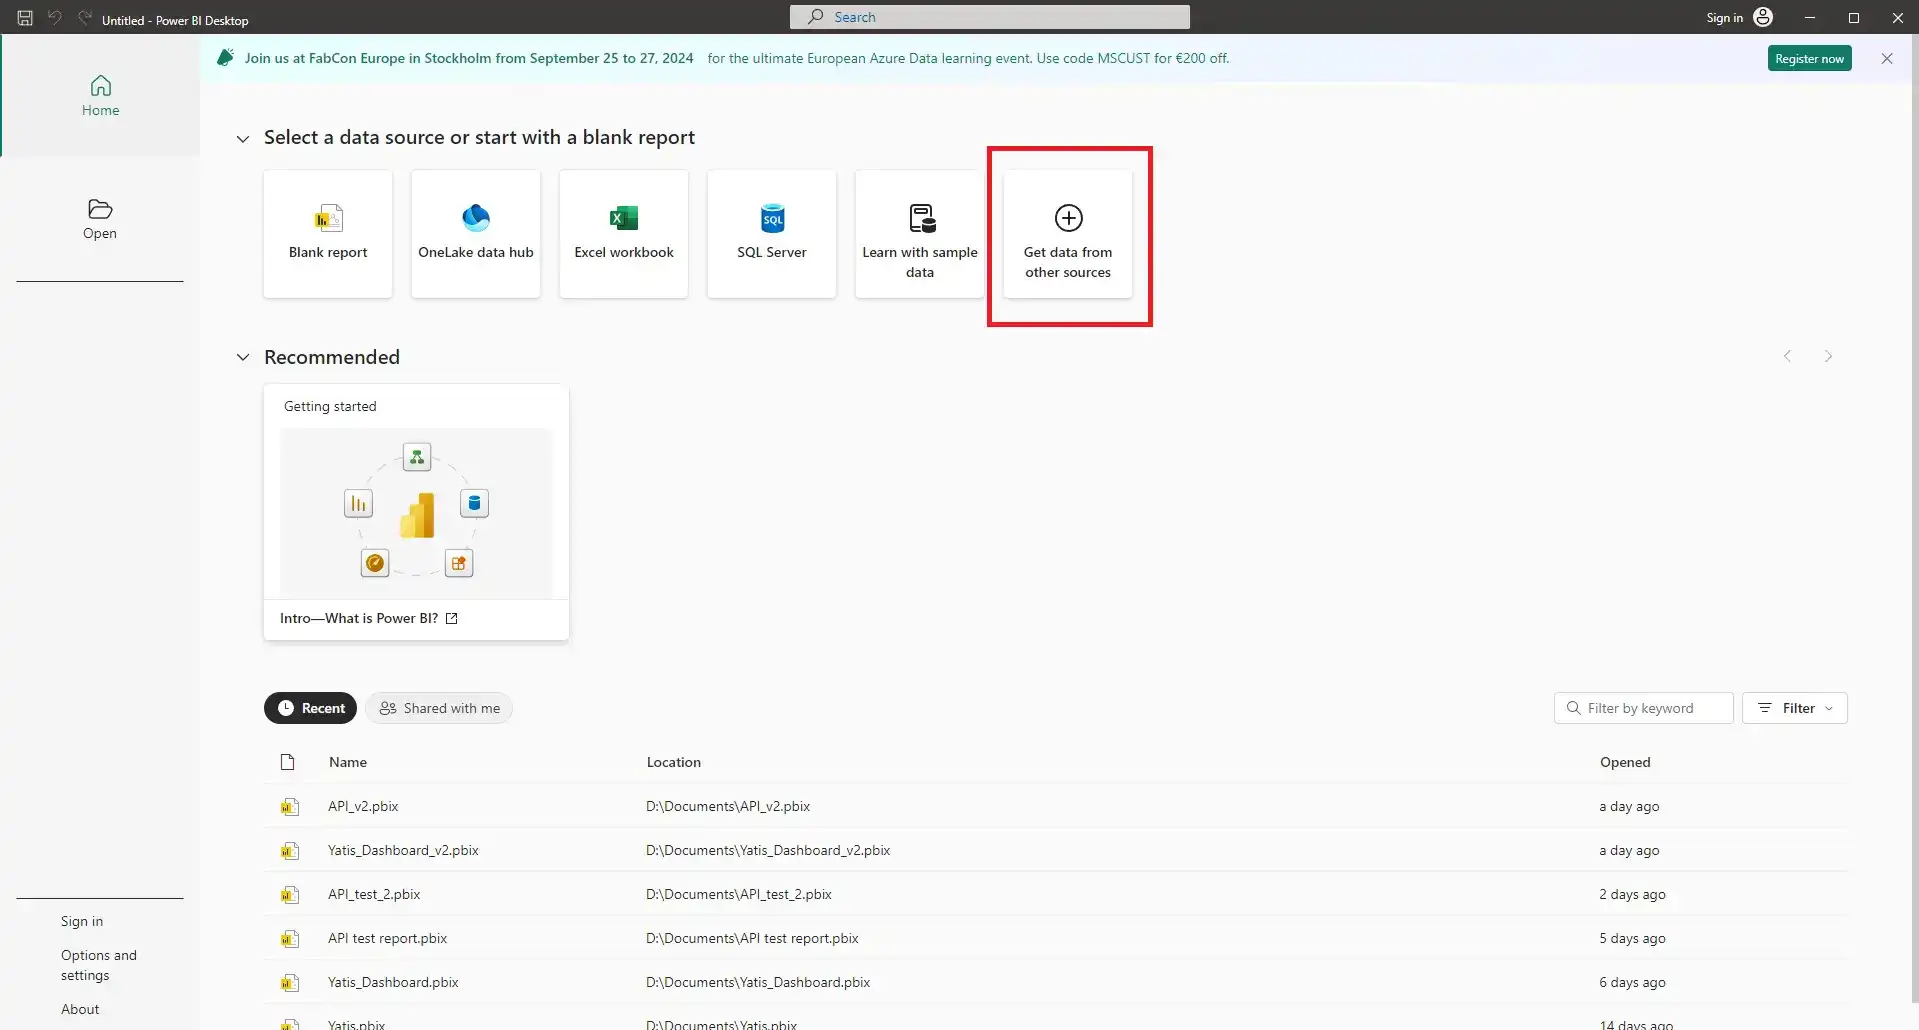
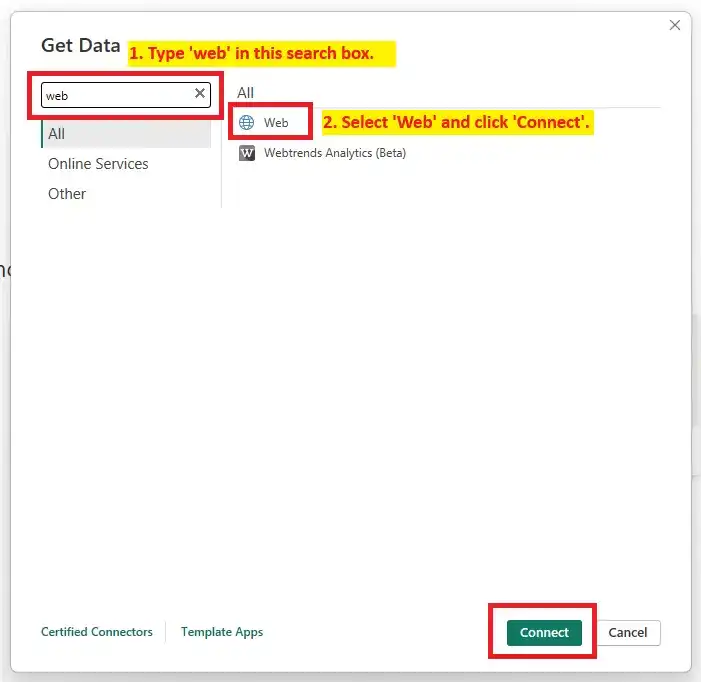
Getting Data from API
- Launch Power BI Desktop on your computer.
- Click on the Get Data from Other Sources tab.
- Search for 'web' in the Search Input Box.
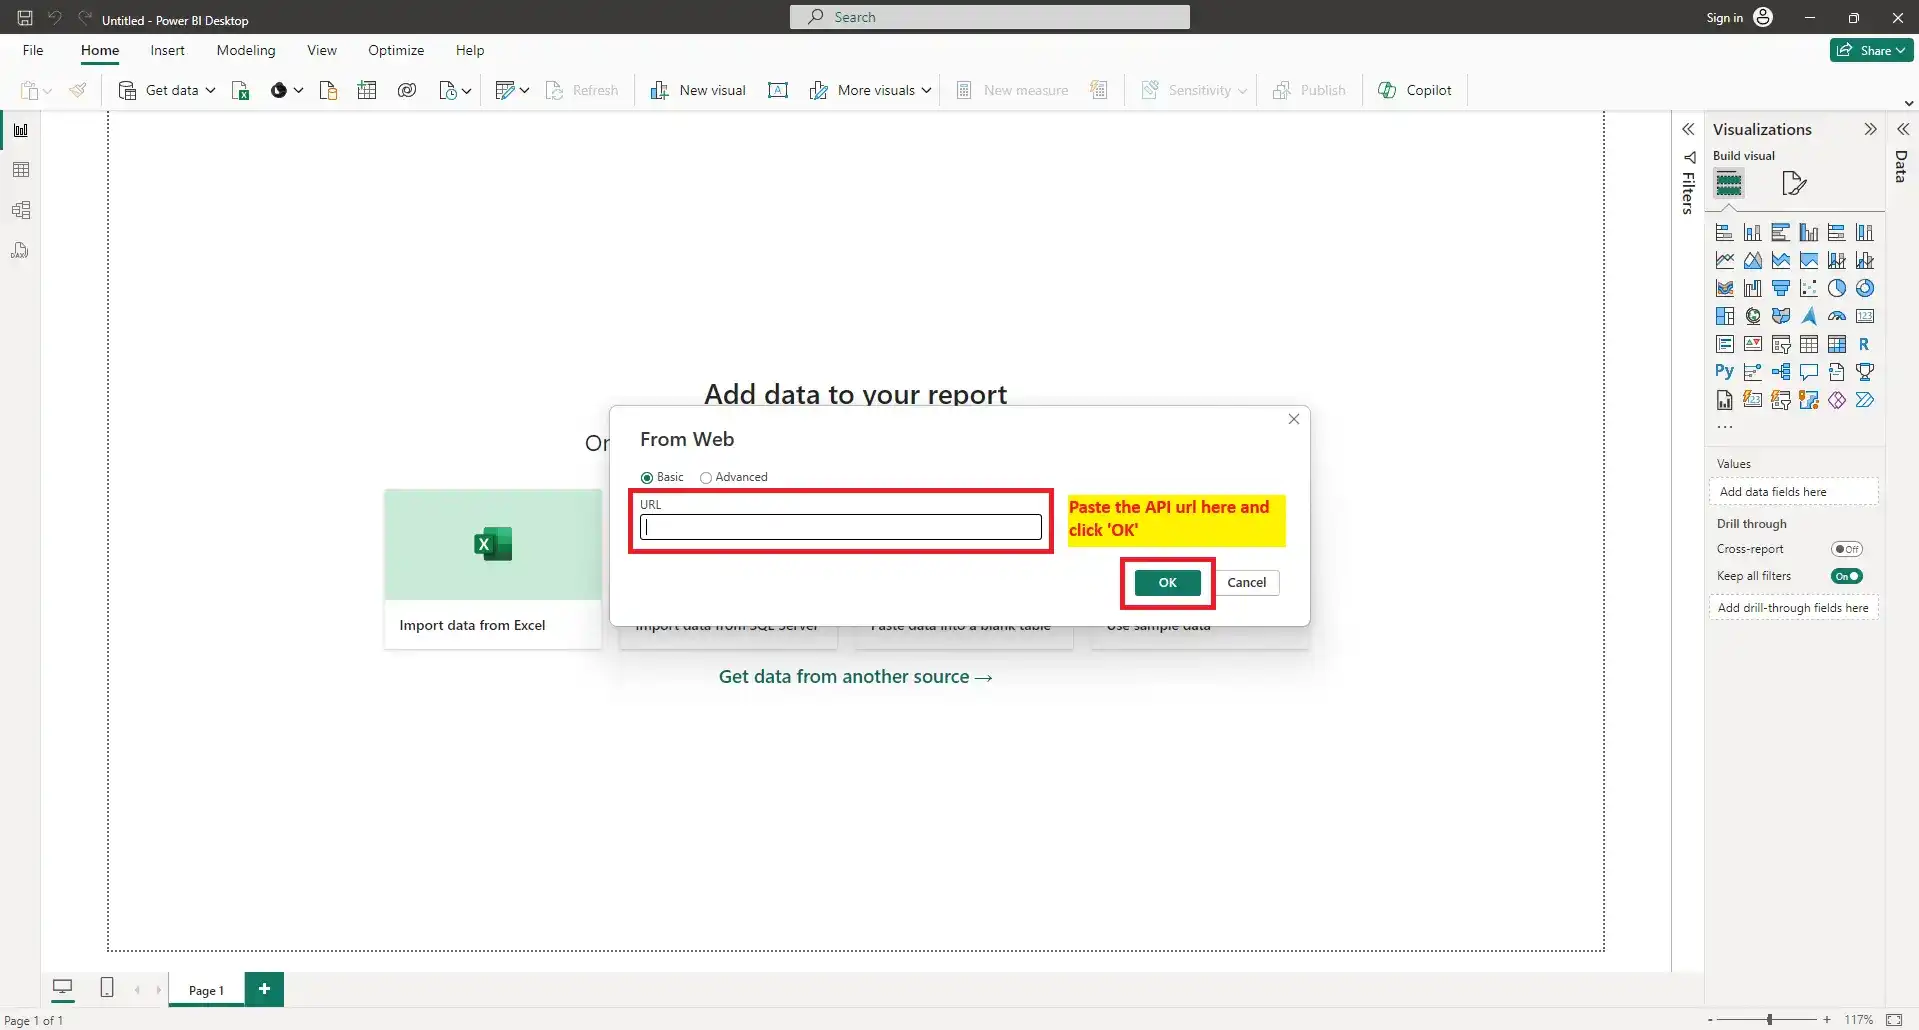
- Paste the API URL in the input box and hit OK.
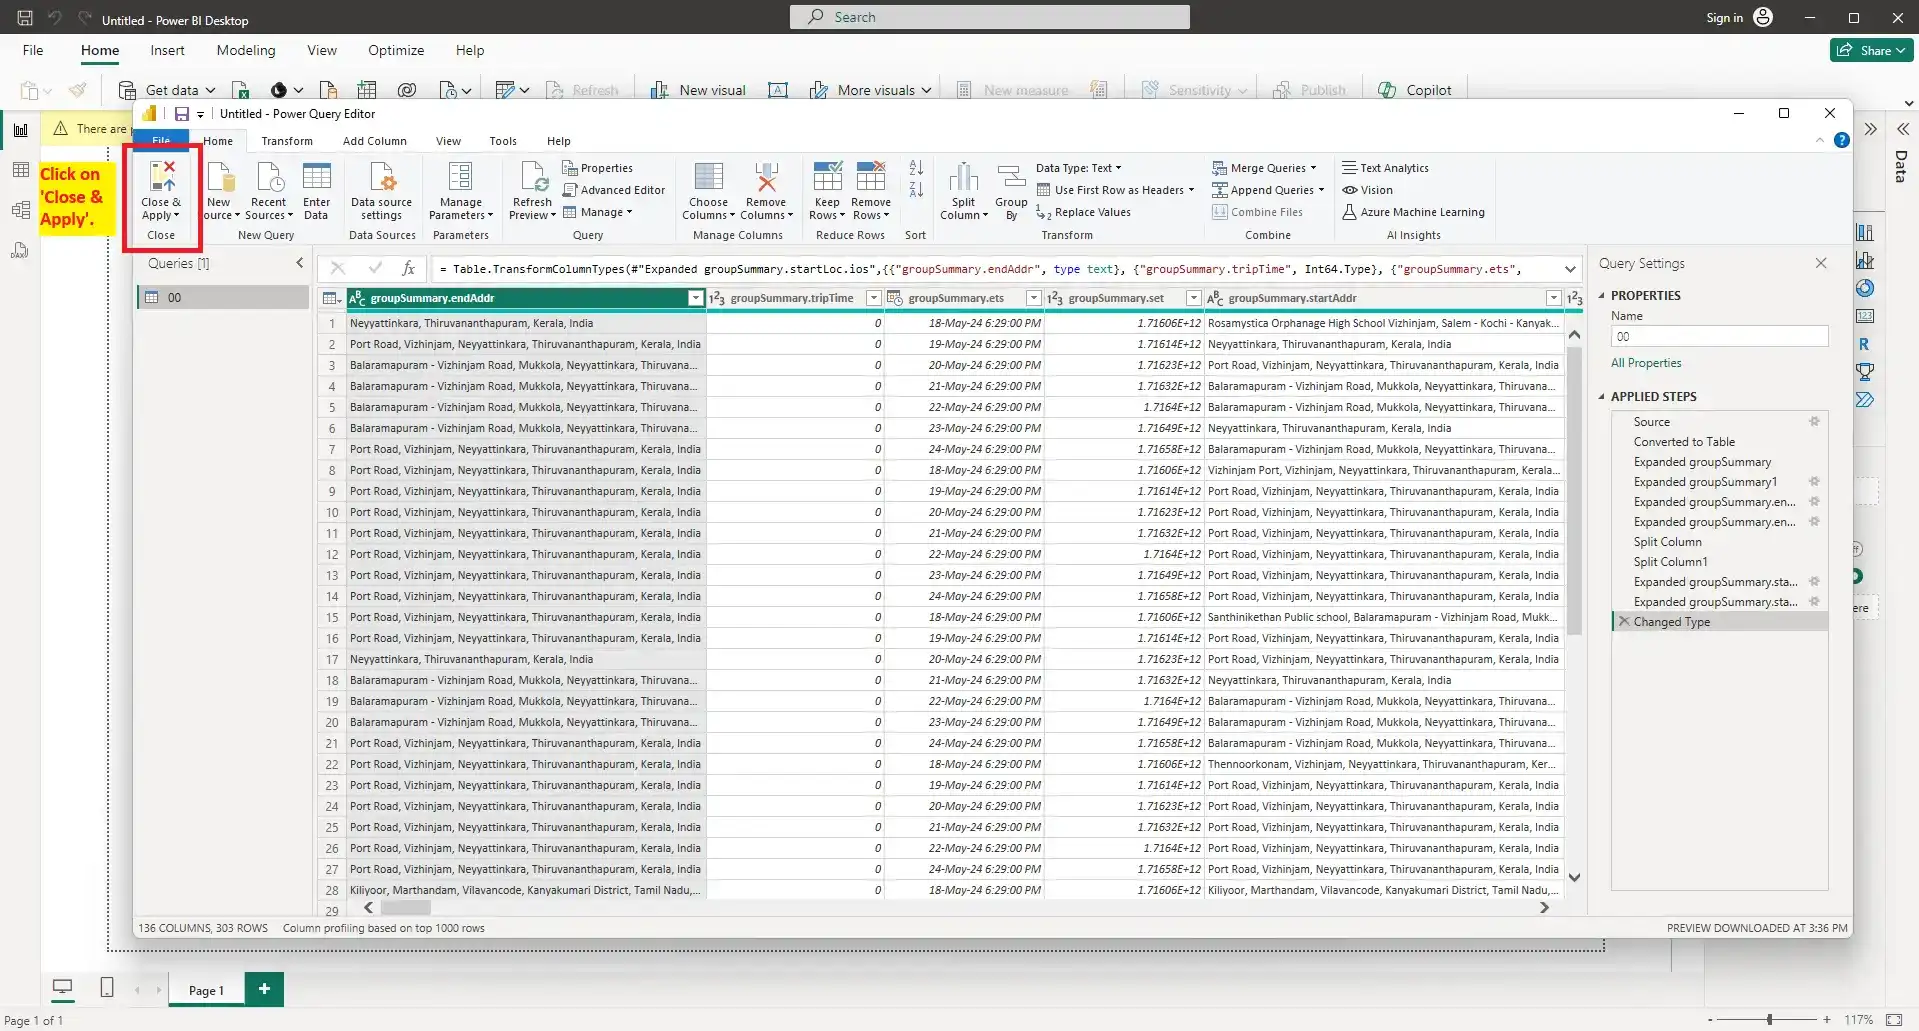
- Now, the Power Query Editor will open. Click on Close & Apply as shown.


Conclusion
This guide has taken you through the essential steps of preparing and importing your data into Power BI, whether from Excel sheets or an API. By following these steps, you ensure that your data is ready for analysis and visualization.
In the next part of this blog, we will dive into the actual creation of reports in Power BI. Stay tuned for insights on how to visualize your data effectively and create dynamic reports.