

Fleet Cost Per Kilometer: Formula, Benchmarks and How Telematics Improves It

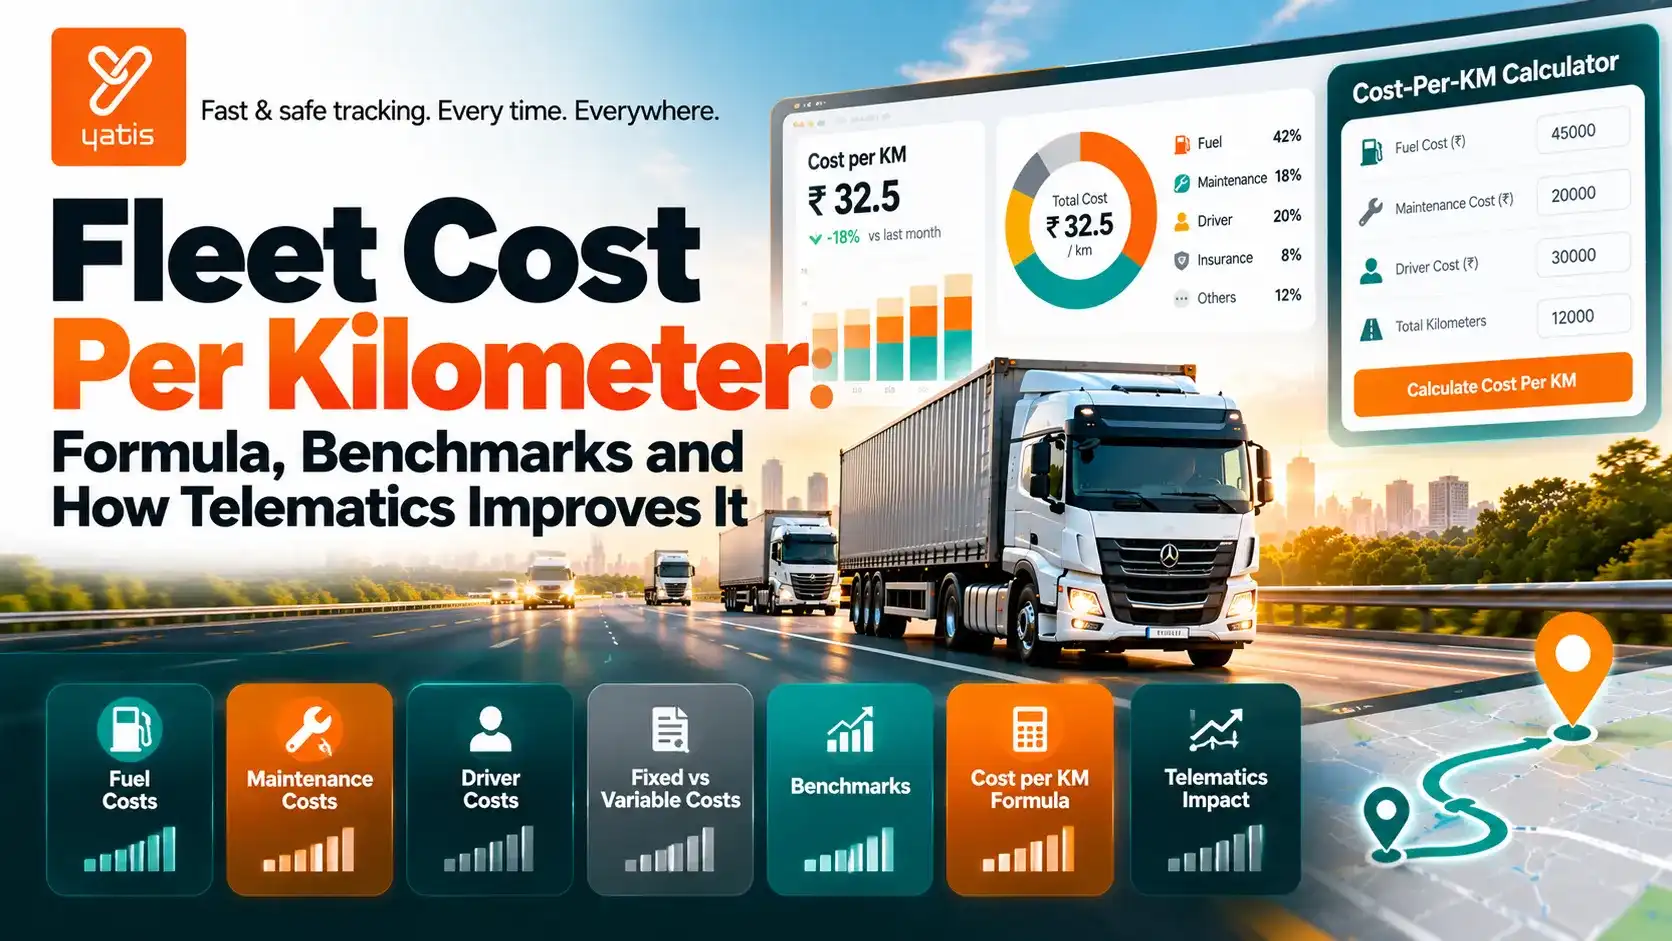
Fleet cost per kilometer turns a complex operating budget into one practical efficiency measure. Used correctly, it helps fleet managers understand what each kilometre costs and where fuel, maintenance, drivers, routing and downtime push that cost upward.
The Cost-per-KM Analysis Flow
1. Collect Costs
Gather fuel, maintenance, tyre, driver, fixed and route costs.
2. Measure KM
Record kilometres for the same period and scope.
3. Calculate
Divide total cost by total kilometres travelled.
4. Find Drivers
Break down fuel, idle, route and maintenance contributors.
5. Reduce Waste
Act on exceptions and track the cost-per-km trend.
What Is Fleet Cost Per Kilometer?
Fleet cost per kilometer is the average cost incurred to operate a vehicle or fleet for every kilometre travelled during a defined period.
It becomes useful when segmented by vehicle, route, depot, driver, vehicle type and time period. A monthly fleet spend number alone cannot show whether the same spend generated 50,000 km or 150,000 km.
Fleet Cost Per KM Formula
If defined fleet costs are ₹6,00,000 and the fleet travels 60,000 km:
The formula is simple; the important part is defining the cost scope and matching costs and kilometres to the same period.
What Costs Should Be Included?
Variable Costs
Fuel, tyres, tolls, repairs and usage-linked operating costs.
Fixed Costs
Depreciation, financing, insurance, permits and other time-based costs.
People Costs
Driver wages, allowances, overtime and other relevant labour costs.
Fixed vs Variable Fleet Costs
| Cost | Examples | Typical Behaviour |
|---|---|---|
| Fuel / energy | Diesel, petrol, electricity | Usually changes with usage and operating conditions. |
| Maintenance | Servicing, repairs, parts | Influenced by usage, age and condition. |
| Tyres | Replacement and repair | Influenced by km, load, roads and driving. |
| Driver | Salary, allowances, overtime | Fixed, variable or mixed by operating model. |
| Insurance | Annual premium | Generally fixed for the measurement period. |
| Depreciation / finance | Depreciation, interest | Usually time-based. |
| Tolls / permits | Tolls, road fees, permits | Often route or trip dependent. |
Fuel Cost Per Kilometer
Fuel cost per km depends on fuel price and vehicle efficiency.
At ₹90/litre and 15 km/l, fuel cost is ₹6/km. Yatis' GPS Tracking System can be used alongside fuel, route and driver data to investigate fuel-related patterns.
Maintenance Cost Per Kilometer
Track this by vehicle and age. A rising figure can indicate ageing assets, poor preventive maintenance, harsh operating conditions or replacement needs.
Driver Cost Per Kilometer
Define whether overtime, allowances and incentives are included before comparing vehicles.
How Idle Time Affects Cost Per KM
Idle time matters because a vehicle can consume fuel and incur operating costs without adding kilometres. Track both idle hours and idle ratio.
Yatis' GPS Tracking Data Analytics provides a framework for turning vehicle data into measurable operational KPIs.
How Route Efficiency Affects Cost Per KM
Unnecessary detours, route deviations and empty running can increase fuel, driver and maintenance costs.
- Planned vs actual kilometres
- Route adherence
- Empty kilometres
- Average trip distance
- Distance per completed delivery or job
- Route deviation events
Yatis' Geofencing for Fleet Management can support analysis of vehicles entering, leaving or operating outside defined geographic zones.
How Telematics Can Improve Fleet Cost Per KM
Telematics does not automatically reduce costs. Its value comes from making operational waste measurable enough to act on.
| Cost Driver | Telematics Signal | Potential Action |
|---|---|---|
| Excess fuel | Fuel, idle, driving behaviour | Coach behaviour and investigate abnormal consumption. |
| Unproductive distance | Route history, deviations, trips | Review routes and dispatch rules. |
| Downtime | Status, diagnostics, maintenance | Improve preventive maintenance and response. |
| Underutilisation | Trips, operating hours, activity | Review allocation and fleet size. |
| Driver-related cost | Driving and route behaviour | Targeted coaching and process improvement. |
Yatis' Predictive Fleet Management resource covers the use of telematics data for more proactive maintenance and operational decisions.
Worked Example: Calculating Fleet Cost Per KM
Consider a hypothetical 20-vehicle delivery fleet for one month:
| Cost Item | Monthly Cost |
|---|---|
| Fuel | ₹3,60,000 |
| Maintenance & repairs | ₹90,000 |
| Tyres | ₹30,000 |
| Drivers | ₹2,00,000 |
| Insurance / depreciation / finance allocation | ₹1,20,000 |
| Tolls and other costs | ₹50,000 |
| Total | ₹8,50,000 |
If the fleet travelled 85,000 km:
The calculated cost is ₹10/km under this defined cost scope.
What If Telematics Helps Reduce Waste?
Suppose measurable interventions reduce monthly operating cost by ₹42,500 while kilometres remain broadly stable.
New cost per km = ₹8,07,500 ÷ 85,000 = ₹9.50/km
That is a ₹0.50/km improvement, equal to ₹42,500 across 85,000 km. This is an illustrative scenario, not a promised savings figure.
How to Benchmark Fleet Cost Per KM
There is no universal good cost per km. Compare like-for-like vehicles, routes, loads, fuel types and cost scopes.
Same Vehicle Type
Compare vehicles with similar size, capacity and duty cycle.
Same Fuel Type
Keep diesel, petrol, CNG and electric comparisons separate.
Similar Route
Match urban, highway, terrain and traffic conditions.
Similar Load
Account for payload, utilisation and empty running.
Same Cost Scope
Use identical cost categories and measurement periods.
- Vehicle vs fleet median
- Current month vs baseline
- Route vs route
- Depot vs depot
- Vehicle age groups
- Before vs after intervention
Cost Per KM vs Cost Per Trip
| Metric | Best For | Limitation |
|---|---|---|
| Cost per km | Distance-driven operating efficiency | Can hide trip-output differences. |
| Cost per trip | Individual trips and routes | Trip distances vary. |
| Cost per delivery / job | Operational productivity | Requires reliable output data. |
| Cost per tonne-km | Freight efficiency | Requires accurate load data. |
Fleet Cost Per KM Dashboard
₹10.00
Fleet Cost / KM
₹6.00
Fuel / KM
₹1.06
Maintenance / KM
₹2.35
Driver / KM
8.4%
Idle Ratio
91%
Route Adherence
Common Fleet Cost-per-KM Mistakes
1. Mixing Cost Scopes
One report includes depreciation while another excludes it. They are not directly comparable.
2. Using Different Kilometre Periods
Costs and kilometres must cover the same measurement window.
3. Treating a Benchmark as Universal
Cost varies by fleet type, geography, load, fuel, age and operating model.
4. Looking Only at Fuel
Driver, maintenance, tyres, finance, depreciation and tolls can materially affect total cost.
5. Assuming Telematics Creates Savings Automatically
Telematics creates visibility; management action creates operational change.
How to Build a Cost-per-KM Calculator
A practical Cost-per-KM Calculator should capture:
| Input | Purpose |
|---|---|
| Total kilometres | Denominator. |
| Fuel spend | Fuel cost per km. |
| Maintenance spend | Maintenance cost per km. |
| Tyre spend | Tyre running cost. |
| Driver cost | Labour cost. |
| Insurance / finance / depreciation | Fixed or time-based cost. |
| Tolls and other costs | Route and operating expenses. |
The calculator should return total cost, cost per km, category cost per km and category contribution percentage.
Conclusion
Fleet cost per kilometer is most useful as a diagnostic metric, not just an accounting number. Calculate total cost consistently, separate fixed and variable components, measure fuel and maintenance per km, then use telematics to identify the operational events behind cost differences.
Explore Yatis fleet solutions and related guides in resources to connect operational data with better fleet decisions.
External Sources & Further Reading
- U.S. Department of Energy — Telematics for Federal Fleets
- Yatis — GPS Tracking System
- Yatis — GPS Tracking Data Analytics
- Yatis — Predictive Fleet Management
External guidance is used for general telematics context, not as an Indian fleet cost benchmark. Numerical examples are illustrative.
Frequently Asked Questions About Fleet Cost Per KM
Measure and Reduce Your Fleet Cost Per KM
Start tracking fleet cost per kilometer with Yatis telematics — connect fuel, maintenance, driver and route data to find waste and bring every kilometre down.
Get Started Today →