

GPS Tracking Data Analytics: Turning Fleet Data Into Better Decisions

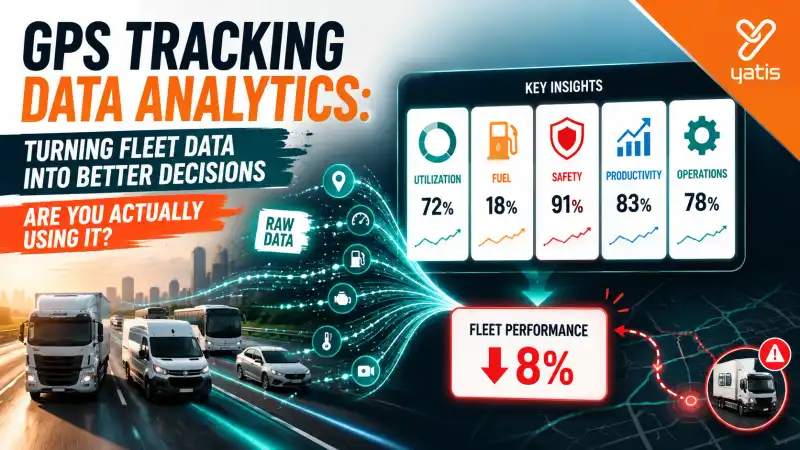
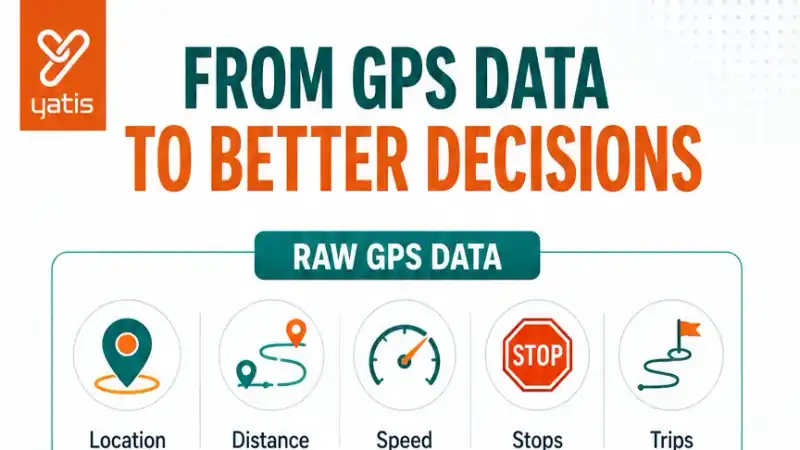
A GPS tracker can generate enormous amounts of data. Every trip can produce information about location, distance, speed, stops, idle time, routes, journey duration and vehicle movement.
But data by itself doesn't improve fleet performance. The real value begins when that data answers a business question: are our vehicles being utilized properly? Where are we losing time? Which vehicles consume more fuel? Which routes consistently underperform? Where should the operations team intervene?
That's where GPS tracking data analytics becomes useful.
What Is GPS Tracking Data Analytics?
GPS tracking data analytics converts location, movement and telematics data into KPIs, trends, reports and operational insights. It helps fleet managers move beyond real-time tracking to understand how vehicles and drivers are performing over time.
Think of the progression as: GPS data → measurement → KPI → trend → insight → decision.
For example, the GPS data records that a vehicle stopped for 38 minutes. The KPI is average stop duration. The trend shows stops increasing at one delivery location. The insight is that this location may be creating operational delays. The decision is to investigate the delivery process.
This is the difference between tracking an event and learning from it.
What Data Does GPS Tracking Generate?
A typical connected fleet can generate several categories of information.
Location Data
- Current location
- Historical location
- Routes
- Distance travelled
Movement Data
- Speed
- Stops
- Idling
- Trip duration
- Route deviations
Vehicle Data
- Engine information
- Diagnostics
- Fuel information
- Operating hours
Driver Data
- Driving events
- Overspeeding
- Harsh braking
- Acceleration patterns
The exact data available depends on the tracking hardware, vehicle integration and platform. The important point is that analytics turns these individual signals into fleet-level patterns.
The Five KPI Groups Every Fleet Dashboard Should Answer
Instead of overwhelming fleet managers with dozens of metrics, a useful dashboard should answer five fundamental questions.
| KPI Group | Core Question |
|---|---|
| Utilization | Are our vehicles being used effectively? |
| Productivity | How efficiently are vehicles completing work? |
| Cost | Where is fleet expenditure increasing? |
| Safety | Where are operational risks appearing? |
| Operations | Where are time and route inefficiencies occurring? |
These five categories provide a practical foundation for GPS tracking data analytics.
Fleet Utilization Analytics
Fleet utilization analytics measures how effectively vehicles are being used by analysing factors such as operating time, trip activity, idle periods and vehicle availability. It can help identify underused and heavily utilized vehicles.
Consider a fleet of 50 vehicles. A basic tracking system can show all 50 vehicles. Analytics can reveal that 12 have high utilization, 27 are normal and 11 are low. That creates a much more useful management question: why are 11 vehicles underutilized?
Possible reasons could include poor allocation, seasonal demand, route imbalance, excess fleet capacity or vehicle downtime. The dashboard doesn't solve the problem automatically. It makes the problem visible at fleet level.
Productivity Analytics
Tracking distance alone doesn't necessarily tell you whether a fleet is productive. Two vehicles can travel the same distance while completing very different amounts of work.
Useful productivity metrics can include trips completed, distance per trip, trip duration, stops per trip, average dwell time, on-time performance and operating hours.
For example, Vehicle A completes eight trips a day while Vehicle B completes four. If both vehicles cover similar distances, there may be an operational difference worth investigating. This is why fleet analytics should connect movement data with operational outcomes wherever possible.
Fuel Analytics
Fuel is one of the most important fleet cost areas. GPS and telematics data can help analyse patterns around fuel consumption, distance, idling, route characteristics, vehicle usage and driver behaviour.
| Vehicle | Distance | Fuel Efficiency |
|---|---|---|
| V01 | 4,200 km | 8.6 km/l |
| V02 | 4,050 km | 8.1 km/l |
| V03 | 4,180 km | 7.4 km/l |
The interesting question isn't which vehicle has the lowest number. It's why V03 is performing differently. That could lead to an investigation of vehicle condition, load, route, idling, driving behaviour or maintenance. Analytics therefore helps turn fuel data into a diagnostic starting point.
Driver Safety Analytics
GPS tracking can produce individual driving events. Analytics aggregates them into patterns. For example, Driver A records three harsh events, Driver B records 21 and Driver C records seven.
A dashboard can go one step further and track changes over time. If Driver B moves from 21 events in week one to 15 in week two and nine in week three, that tells the fleet manager whether an intervention is producing improvement. This is much more useful than simply counting alerts, and it connects directly to driver safety programmes.
Route and Journey Analytics
Route analytics uses GPS journey data to compare routes, travel times, stops, delays and route deviations. It helps fleet managers identify recurring inefficiencies and understand how actual journeys differ from expected operations.
A route may look efficient on paper. Actual GPS data may reveal that a planned 60-minute journey averages 82 minutes in practice. The difference matters.
Analytics can help identify whether the additional time is associated with congestion, frequent stops, route deviations, loading delays, delivery dwell time or operational constraints. The goal isn't simply to find a shorter route. It's to understand why the current operation takes as long as it does.
Idle-Time Analytics
Idling can be easy to overlook because the vehicle isn't technically travelling. But across a large fleet, small periods can accumulate.
Consider Vehicle A at 25 minutes a day, Vehicle B at 42 minutes and Vehicle C at 18 minutes. Now aggregate the entire fleet. If 100 vehicles average 35 minutes of unnecessary idle time per day, the operational impact becomes much more significant.
Analytics can identify high-idling vehicles, high-idling locations, time-of-day patterns, driver-level patterns and changes over time. The important metric isn't merely how much idling occurred. It is where and why idling is happening.
GPS Tracking Dashboards: What Should They Show?
A useful fleet dashboard should not simply display a map covering most of the screen. It should answer business questions.
An executive dashboard might open with a fleet overview: 250 vehicles, 187 active, 31 idle and 32 unavailable. Beneath that, utilization at 78% against the previous period, fuel at 8.2 km/l trending down 3%, safety at 127 events trending down 12%, productivity at 6.4 trips per vehicle trending up 5%, and operations showing an average dwell time of 23 minutes trending up 8%.
This is more valuable than simply showing 250 vehicle icons on a map.
Reporting vs Analytics
These terms are often used interchangeably, but they aren't identical.
Reporting tells you what happened — for example, total distance last month was 1.4 million km. Analytics helps answer what it means — for example, distance increased 9% but completed trips increased only 2%. That difference could warrant investigation.
So a report is information and analytics is interpretation. A strong fleet platform needs both.
Real-Time Dashboard vs Historical Analytics
Another important distinction. A real-time dashboard is useful for current vehicle status, live location and active alerts, and current fleet availability. Historical analytics is useful for trends, comparisons, performance changes, fleet benchmarking and recurring problems.
You need both. A fleet manager may need to know where Vehicle 27 is right now at 10:00 AM. But at the end of the month they may need to know why Vehicle 27's utilization declined by 12%. Those are two different questions, which is why real-time and historical tracking serve complementary roles.
Compare the Right Things
A common analytics mistake is looking at absolute numbers without context. Vehicle A covers 8,000 km and Vehicle B covers 5,000 km. It might appear that Vehicle A performed better. But what if Vehicle A completed 25 trips and Vehicle B completed 40? Now distance alone tells a very different story.
Good fleet analytics should enable comparisons by vehicle, driver, route, depot, time period, vehicle type and operating condition. This is where dashboards become genuinely useful.
The Most Useful Fleet Analytics Workflow
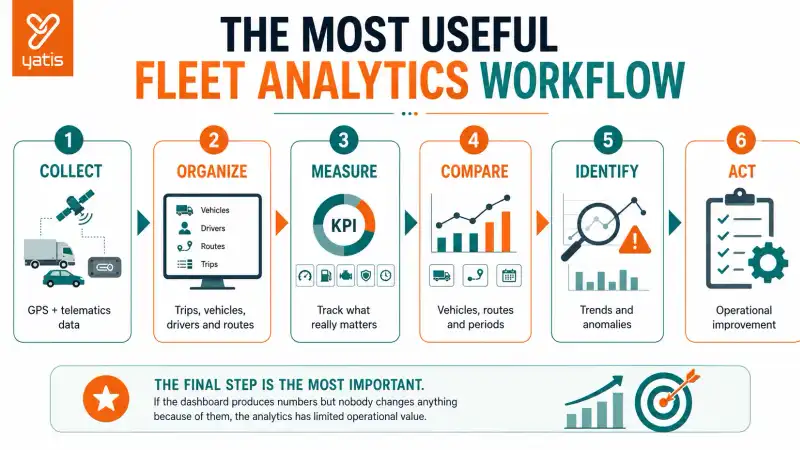
A practical analytics workflow moves through six steps.
- Collect — GPS and telematics data.
- Organize — trips, vehicles, drivers and routes.
- Measure — KPIs.
- Compare — vehicles, routes and periods.
- Identify — trends and anomalies.
- Act — operational improvement.
The final step is the most important. If the dashboard produces numbers but nobody changes anything because of them, the analytics has limited operational value.
What Should Businesses Look for in a Fleet Analytics Platform?
A useful GPS tracking analytics platform should provide more than attractive charts.
Flexible dashboards
Can different users see the metrics relevant to them?
Historical data
Can managers compare performance over time?
Drill-down capability
Can a fleet-level problem be traced to an individual vehicle or trip?
Custom reporting
Can reports reflect actual business KPIs?
Comparisons
Can managers compare vehicles, routes, drivers and periods?
Actionable alerts
Can important changes trigger operational attention?
Data integration
Can GPS information be combined with other relevant fleet data, and is the underlying location data accurate enough to trust?
The best dashboard isn't necessarily the one with the most charts. It's the one that helps answer the right questions quickly.
From GPS Data to Fleet Intelligence
The progression can be summarized as a chain. GPS answers where the vehicle went. Data analytics answers what happened across the fleet. KPIs answer how we are performing. Trends answer whether performance is improving or deteriorating. Insight suggests what may be causing the change. The decision answers what we should change.
This is where tracking data becomes operational intelligence. Analytics explains the fleet's data. Predictive management uses data to anticipate what's next.
Conclusion
A GPS tracker can generate thousands of data points. But fleet managers don't need thousands of numbers. They need answers. Are vehicles being utilised effectively? Where is time being lost? Which vehicles are consuming more fuel? Which routes are underperforming? Where are safety patterns changing? Is fleet performance improving or deteriorating?
That's the purpose of GPS tracking data analytics. The progression is simple: data → KPI → trend → insight → decision.
Real-time tracking tells you what is happening now. Historical analytics tells you what has been happening and where the fleet is changing. And when those insights are connected to a broader fleet management solution, GPS data becomes more than a record of where vehicles travelled — it becomes a foundation for improving how the fleet operates.
Frequently Asked Questions
Ready to get started?
Contact Yatis Telematics to turn your fleet's GPS data into KPIs, trends and decisions your operations team can act on.
Contact Us →