

Fleet Productivity: How to Measure Vehicle and Driver Performance With Telematics

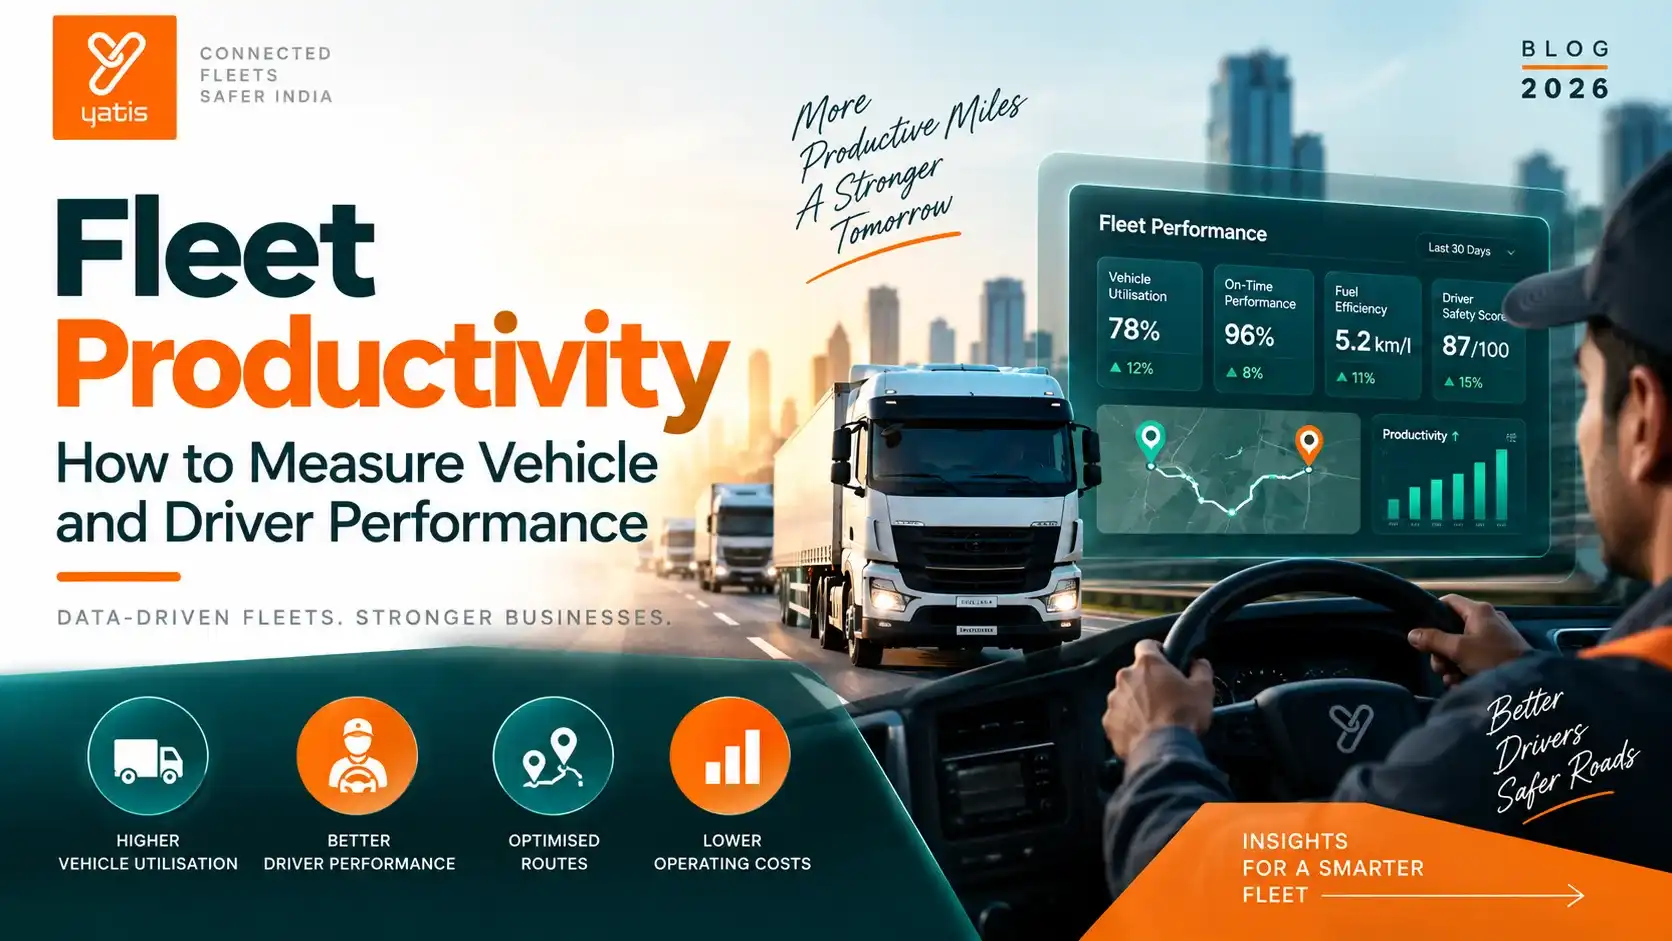
A fleet can be busy without being productive. Here is how to use telematics data to measure what actually matters — utilisation, driver performance, route efficiency, downtime and business output.
When fleet managers talk about productivity, the conversation often starts with kilometres, trips or vehicle utilisation. But activity is not the same as output. A vehicle can travel thousands of kilometres and still deliver poor productivity if too much time is spent idling, waiting, deviating from routes or sitting unavailable.
That is why modern fleet management needs to move beyond the question “Where is my vehicle?” and toward a more valuable question: “How effectively is my fleet converting time, vehicles and driver effort into productive work?”
GPS tracking gives you visibility. Telematics gives you the data to measure performance — and improve it.
What Is Fleet Productivity?
Fleet productivity is a measure of how effectively vehicles, drivers and operating resources are converted into useful business output.
Depending on the fleet, that output could mean deliveries completed, service jobs closed, passengers transported, productive kilometres, customer visits or route coverage.
The important point is that there is no single universal productivity formula. A last-mile delivery fleet and a field-service fleet should not be judged by exactly the same KPI.
The 12 Fleet Productivity Metrics That Matter
Rather than building a dashboard full of disconnected numbers, group KPIs around the decisions your fleet team actually needs to make.
The Productivity Measurement Loop
01. Capture
GPS, vehicle and driver data.
02. Measure
Convert events into KPIs.
03. Diagnose
Find the source of waste.
04. Act
Coach, optimise and maintain.
05. Improve
Track the KPI trend.
01. Vehicle Utilisation Rate
Vehicle utilisation shows how much of an asset's available operating capacity or time is actually being used.
Decision: Identify underused or overloaded assets.
02. Productive Driving Time
Separate time spent performing useful trips from time lost to waiting, unnecessary stops or prolonged idle periods.
Decision: Compare shifts, routes and operating patterns.
03. Idle Time Percentage
Idle time can represent avoidable fuel use and lost operating time. Measure it in context rather than treating every stationary engine-on event identically.
Decision: Identify idle hotspots and behaviour patterns.
04. Driver Productivity
Connect driver time and activity to useful output such as completed deliveries, jobs or service calls.
Decision: Balance workload and identify process constraints.
05. Driver Behaviour Score
Use relevant events such as speeding, harsh braking and harsh acceleration as indicators for coaching and safety improvement. Structured driver safety monitoring helps turn these events into targeted coaching instead of anecdotes.
Decision: Target coaching instead of relying on anecdotes.
06. Route Adherence
Measures how closely vehicles follow planned routes or operational corridors. Repeated deviations can expose planning or execution problems. It works best alongside route optimisation so plans stay realistic and measurable.
Decision: Investigate recurring route exceptions.
07. On-Time Arrival Rate
Measures the percentage of scheduled stops, jobs or deliveries completed within the defined service window. For service and delivery operations, including logistics fleets, it directly protects service levels and customer experience.
Decision: Protect service levels and customer experience.
08. Average Stop Duration
Shows how long vehicles remain at customer, delivery or service locations. Recurring high-duration locations may be process bottlenecks.
Decision: Find location-level productivity constraints.
09. Kilometres per Job or Delivery
Connect distance travelled with actual work completed. It is particularly useful for understanding route density and trip efficiency.
Decision: Compare route and delivery efficiency.
10. Vehicle Downtime
Measures time an asset is unavailable because of maintenance, breakdowns, repairs or other operating constraints. Connected diagnostics and fleet intelligence help protect capacity through better maintenance planning.
Decision: Protect fleet capacity through better maintenance planning.
11. Cost per Productive Kilometre
Links relevant operating cost to kilometres that contribute to the fleet's defined output.
Decision: Compare vehicles, routes and operating models.
12. Fleet Productivity Score
A composite directional score can bring selected KPIs together using weights that reflect the business's priorities.
Decision: Give management one trend while retaining the underlying KPIs.
Measure Productivity Across Three Layers
The biggest mistake in fleet analytics is looking at vehicle data in isolation. Productivity emerges from the interaction between vehicle, driver and route.
| Layer | What to measure | Question to ask |
|---|---|---|
| Vehicle | Utilisation, productive time, idle %, downtime, cost/km | Are assets available and being used efficiently? |
| Driver | Productivity, behaviour, idle time, on-time performance | Is driver time being converted into safe, productive work? |
| Route | Adherence, on-time arrival, stop duration, km/job | Are journeys designed and executed efficiently? |
What Should a Fleet Productivity Dashboard Show?
A good dashboard should answer three questions quickly:
- What is happening? — show the current KPI position.
- Why is it happening? — surface the underlying exceptions.
- What needs action? — identify the vehicle, driver, route or location that requires intervention.
A Better Dashboard Architecture
Executive
Overall productivity trend.
Asset
Utilisation and downtime.
Driver
Behaviour and productivity.
Route
Adherence and on-time performance.
Dashboard principle: optimise for decisions, not the number of charts. A manager should be able to move from an exception to its likely cause without opening five different reports.
How to Use Fleet Productivity Metrics in Performance Reviews
KPIs become useful when they change behaviour and operating decisions. A practical review cycle looks like this:
1. Baseline
Establish current performance by vehicle, driver, route or operating unit.
2. Target
Define a realistic target based on the fleet's operating model and service requirements.
3. Exception
Focus on recurring outliers instead of treating every deviation as a problem.
4. Diagnosis
Cross-check telematics with workload, route, maintenance and operating context.
5. Action
Assign coaching, route redesign, maintenance, scheduling or asset reallocation.
6. Re-measure
Check the same KPI after the intervention to determine whether it worked.
6 Ways to Improve Fleet Productivity With Telematics
1. Reduce avoidable idle time
Identify where idling is concentrated by vehicle, driver, location and shift. The pattern tells you where an intervention is likely to have the biggest effect.
2. Reallocate underused assets
Compare similar vehicles by operating hours, distance and days in service. Persistent underutilisation may signal an opportunity to rebalance the fleet.
3. Improve route execution
Use route adherence, stop duration, kilometres per job and on-time performance together. Optimising one metric in isolation can create unintended trade-offs.
4. Coach recurring driver behaviour
Look for repeated behaviour patterns rather than one-off events. Coaching becomes more specific when the manager can show when and where the behaviour occurs.
5. Reduce vehicle downtime
Track unavailable hours and recurring maintenance patterns. A vehicle that exists on the asset register but cannot perform work is reducing effective capacity.
6. Manage by exception
Do not ask operations teams to manually inspect every vehicle. Use telematics alerts to surface the assets, drivers and routes that materially differ from expected performance.
A Practical Fleet Productivity Scorecard
Use the following as a starting point for a weekly operational review or monthly management meeting.
| Dimension | KPI | Direction | Action |
|---|---|---|---|
| Asset | Vehicle utilisation | Up | Review allocation and scheduling |
| Time | Productive driving time | Up | Investigate waiting and non-productive travel |
| Fuel | Idle time % | Down | Identify hotspots and coach patterns |
| Driver | Driver productivity | Up | Review workload and route design |
| Safety | Behaviour score | Up | Target recurring behaviours |
| Route | Route adherence | Up | Investigate repeated deviations |
| Service | On-time arrival | Up | Review schedule and route constraints |
| Availability | Vehicle downtime | Down | Improve maintenance planning |
| Cost | Cost / productive km | Down | Break down by vehicle and route |
What Does Good Fleet Productivity Look Like?
There is no universal productivity number that defines a good fleet. A healthy profile is one where the metrics reinforce the business objective without creating dangerous trade-offs.
- Vehicles are available when the operation needs them.
- Assets are neither chronically underused nor overloaded.
- Drivers spend more time performing productive work and less time waiting unnecessarily.
- Routes are executed close to plan, with exceptions understood.
- Service commitments are consistently met.
- Safety improves alongside productivity rather than being sacrificed for it.
- Management can connect KPI changes to operational causes and actions.
From Fleet Tracking to Fleet Productivity
Basic GPS tracking answers where a vehicle is. A mature telematics programme adds the layers needed to understand what happened, how performance compares, why it happened and what should change.
The Fleet Intelligence Maturity Curve
1. Track
Where is it?
2. Monitor
What happened?
3. Measure
How are we performing?
4. Diagnose
Why is it happening?
5. Optimise
What should change?
That shift — from visibility to measurement, diagnosis and action — is where telematics starts becoming a productivity system rather than simply a tracking system.
Explore Yatis fleet solutions and related guides in resources to connect operational data with better fleet decisions.
Frequently Asked Questions About Fleet Productivity
Turn Fleet Data Into Better Decisions
Start measuring fleet productivity with Yatis telematics — connect vehicle, driver and route data to improve utilisation, efficiency, safety and overall fleet performance.
Get Started Today →