

How Does Fleet Telematics Work? From GPS Signals to Fleet Intelligence

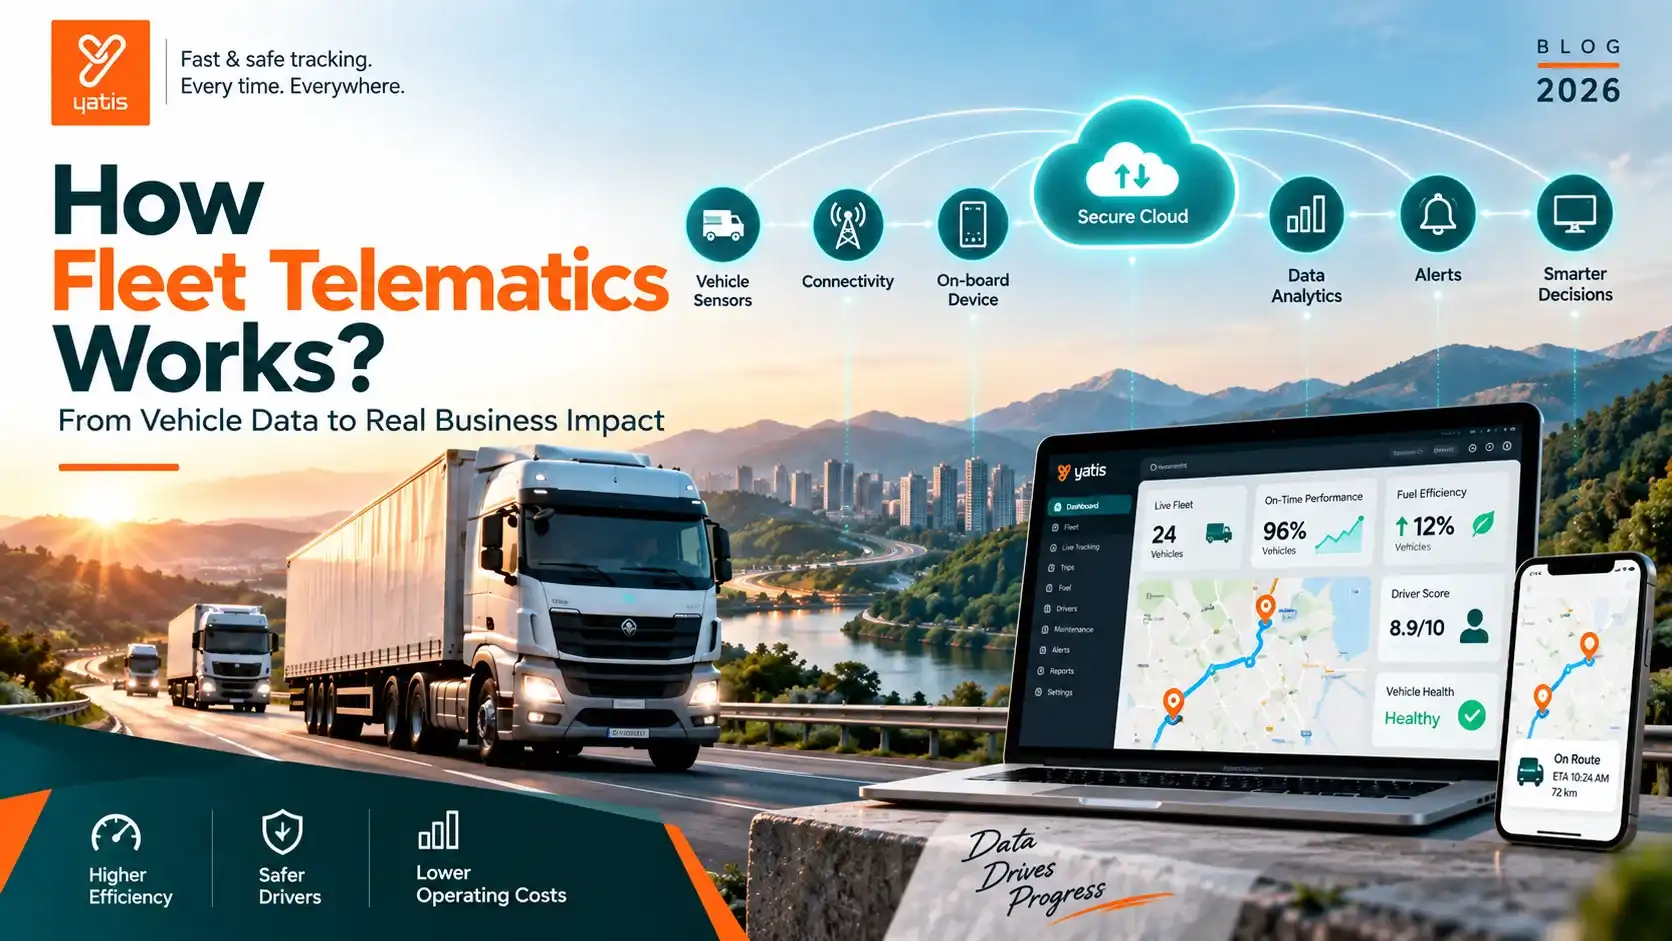
Follow one piece of vehicle data from the moment a signal is created inside a fleet asset to the moment a fleet manager sees an exception, receives an alert or triggers an action. How does fleet telematics work? In simple terms, a fleet telematics system collects signals from a vehicle, moves those signals through a communication network, processes them in software, and turns them into information that people or business systems can use.
The important part is the chain. GPS positioning is only one input. A complete fleet telematics architecture can involve vehicle electronics, sensors, an onboard device or gateway, connectivity, cloud ingestion, data processing, rules, analytics, APIs and dashboards.
The key idea: a telematics platform is not just a tracker. It is a data pipeline connecting a moving physical asset to software and operational decisions.
The Fleet Telematics Architecture at a Glance
From vehicle signal to fleet intelligence, data passes through a simplified path:
Vehicle signal → edge/device → connectivity → cloud → analytics → alert/API → dashboard → action. Real architectures may process, store, filter or route data at several stages.
01. Vehicle
Sensors and ECUs generate position, vehicle and sensor signals.
02. Connectivity
Cellular/IP link carries data from the vehicle to the backend.
03. Edge
Device collects, buffers, filters and transmits selected data.
04. Ingest
Backend receives, authenticates and validates incoming telemetry.
05. Process
Data is normalised, enriched, streamed and stored.
06. Decide
Rules and analytics turn signals into trips, events and exceptions.
07. Expose
Results are exposed through APIs, alerts and dashboards.
08. Act
People and connected systems investigate, respond and decide.
A modern connected-vehicle architecture can be more sophisticated than this simplified diagram. Large-scale systems can separate connectivity, telemetry ingestion, stream processing, storage, APIs and fleet-manager interfaces.
1. Vehicle Layer: Where Telematics Data Begins
Every telematics workflow starts with a physical asset. The vehicle contains multiple information sources, and the architecture determines which signals become available to the platform.
- GNSS position — Positioning: latitude, longitude, speed, heading and timing information from a GPS tracking system or another GNSS source.
- Vehicle network — Vehicle data: selected signals exposed through interfaces such as CAN, as used in solutions like an OBD GPS tracker for commercial vehicles.
- Diagnostics — Health: diagnostic information available through supported interfaces.
- Motion — Events: accelerometer or other motion-derived signals.
- Vehicle state — State: ignition and other operating-state information where available.
- External sensors — IoT: temperature, door, cargo, tyre or other connected inputs.
The exact dataset depends on vehicle, hardware, integration and configuration. Evaluate what a platform can reliably collect from your actual fleet, not a generic feature list.
2. Connectivity: How Does the Data Leave the Vehicle?
Collected data needs a path to the backend. For many commercial fleet deployments, cellular connectivity provides that link. The device typically contains a modem and SIM/eSIM arrangement suitable for the deployment.
Connectivity has two dimensions: coverage and data behaviour. Coverage determines whether the device can communicate; data behaviour determines what happens when the network is slow, unavailable or restored.
Why offline behaviour matters: ask whether the device buffers selected records locally and synchronises them after connectivity returns. Real-time visibility should never be evaluated without understanding network-loss behaviour.
3. The Edge / Telematics Device: The Vehicle's Data Gateway
The onboard telematics device is the bridge between the physical vehicle and the digital platform. Depending on design, it can receive multiple inputs, timestamp them, apply local logic and prepare data for transmission.
- Collect: read positioning, vehicle-interface signals and sensor inputs.
- Buffer: retain selected data during temporary network loss.
- Filter: apply supported device-side rules or event logic.
- Transmit: package and send required information through the network.
This edge layer matters because sending every raw signal continuously is not always the right design. Some applications need high-frequency streams; others need event-driven transmission.
4. Cloud Ingestion: The Backend Receives the Telemetry
When data reaches the backend, the first task is not to draw it on a map. The platform needs to receive, authenticate, validate and route incoming messages.
Simplified Ingestion Path
- Receive: message arrives.
- Authenticate: identify source.
- Validate: check quality.
- Normalise: convert to common fields.
- Route: stream or store for downstream use.
- Process: feed events and analytics.
At larger scale, telemetry can pass through streaming infrastructure before real-time processing and storage, with processed data flowing into stores used by fleet-management interfaces.
5. Analytics: Raw Signals Become Meaningful Events
A raw signal rarely answers a business question by itself. Analytics interprets sequences of data points and turns them into concepts the fleet team understands.
- Trip detection: combine state and movement signals to identify journey start and end.
- Geofence evaluation: compare location against geographic boundaries to identify entry, exit or dwell.
- Event detection: apply rules to identify speeding or defined driving events.
- Vehicle-health interpretation: use available diagnostic or vehicle signals to surface relevant conditions.
- Operational enrichment: join vehicle data with routes, schedules, drivers or business context, including route optimisation inputs.
Analytics is the layer that moves the system from measurement to interpretation.
6. Alerts: When the System Decides Something Needs Attention
An alert is essentially a machine-generated exception. Instead of asking a human to watch every vehicle continuously, the platform watches for defined conditions and surfaces only what needs review through GPS tracking alerts.
| Input | Logic | Output |
|---|---|---|
| Location | Vehicle crosses a configured boundary | Geofence event |
| Speed | Configured threshold is exceeded | Speeding event |
| Motion | Pattern meets event criteria | Driving-behaviour event |
| Vehicle signal | Parameter crosses threshold | Health alert |
| Connectivity | Expected communication is missed | Device exception |
The key question is not how many alerts the system can generate, but which alerts are actionable.
7. APIs: How Telematics Data Moves Into Other Systems
A dashboard is not always the final destination. Enterprises may want telematics data inside a TMS, ERP, dispatch application, customer portal or analytics environment.
An API provides a defined software interface through which authorised applications can access selected telematics data and, where supported, interact with platform workflows. Explore the broader telematics product ecosystem to understand how dashboards, alerts and integrations fit together.
- Vehicle data → telematics platform
- Fleet dashboard
- Alert workflow
- Reporting and analytics
- API → TMS / ERP / CRM / customer app
Ask vendors: what data can we access programmatically, how frequently, in what format, and under what authentication controls?
8. Dashboard: Turning the Data Into a Human View
The dashboard is the visible layer of the architecture, but it is the output of the pipeline rather than the telematics system itself.
- Live state: current vehicle location, movement status and selected live signals.
- History: trips, routes, stops, events and historical vehicle information.
- Exceptions: alerts, deviations, device issues and operational events requiring review.
- Insights: trends, comparisons, reports and analytics for decisions.
Good dashboards are hierarchical: fleet → vehicle → trip → event → underlying data.
9. Actions: Where Fleet Intelligence Creates Value
The final stage is action. Telematics creates operational value when its information changes what someone does.
- Operations: investigate deviations, monitor journeys and respond to exceptions across logistics fleets.
- Safety: identify recurring driving events and support targeted coaching with driver safety tracking.
- Maintenance: use available vehicle-health signals to prioritise maintenance workflows.
- Management: compare trends and make capacity or investment decisions.
This creates a closed loop: measure → interpret → act → observe the outcome → refine.
What Happens When a Vehicle Goes Offline?
This is one of the most useful technical questions to ask a provider. A resilient architecture can use local buffering so selected records are retained at the edge and transmitted after connectivity returns. Exact behaviour depends on hardware memory, firmware and configuration.
- How much data can the device buffer?
- What happens to timestamps during delayed transmission?
- Can the platform distinguish live from synchronised historical data?
- What happens if the device restarts before synchronisation?
- Can administrators see device connectivity health?
Real-Time Does Not Mean Every Signal Is Identical
Real-time is often used loosely. Different data paths have different latency requirements.
| Data | Priority | Reason |
|---|---|---|
| Emergency event | Very low latency | Response can be time-sensitive. |
| Live location | Near-real-time | Useful for coordination. |
| Trip history | Near-real-time / delayed | Historical accuracy often matters more than sub-second delivery. |
| Periodic analytics | Batch / scheduled | Trend analysis may not require streaming. |
How to Evaluate a Fleet Telematics Architecture
Compare platforms in layers instead of starting with dashboard screenshots.
- Vehicle compatibility: can it reliably access the signals your fleet actually needs?
- Device capability: GNSS, interfaces, sensors, storage and firmware behaviour, including compliance options such as an AIS 140 GPS tracker for fleet management.
- Connectivity resilience: behaviour during weak coverage, network loss and reconnection.
- Data architecture: authentication, validation, normalisation, processing and storage.
- Analytics quality: reliable trips, events, alerts and operational insights.
- API openness: authorised programmatic access without manual-export dependence.
- Security and governance: access control, encryption, retention, auditability and tenant separation.
- Operational usability: can teams investigate exceptions and complete workflows?
One Vehicle Journey, End to End
What happens behind one map marker?
- Move: vehicle changes position.
- Sense: device receives signals.
- Transmit: data crosses network.
- Ingest: backend receives.
- Interpret: trip and event logic applied.
- Alert: exception detected.
- Display: operator sees context.
- Act: team responds.
The map marker is therefore only the visible endpoint of a much larger technical process: capture, communication, processing, storage, rules and user interaction.
Why Architecture Matters as Fleets Grow
At small fleet size, a basic application may appear sufficient. As vehicle count, data volume and integrations grow, architecture becomes more important. Scaling introduces questions around message throughput, device management, retention, APIs, historical queries, real-time state, security and availability.
Modern connected-vehicle reference architectures explicitly separate ingestion, stream processing, storage, APIs and user interfaces to handle these workloads.
Fleet Telematics vs Simple GPS Tracking
| Capability | Basic GPS tracking | Fleet telematics |
|---|---|---|
| Positioning | Core | Core plus context |
| Vehicle signals | Limited / absent | Can integrate supported vehicle data |
| Sensor data | Usually limited | Can integrate external IoT sensors |
| Event logic | Basic alerts | Rules and analytics |
| APIs | May be limited | Often central to enterprise integration |
| Fleet intelligence | Basic visibility | Context, exceptions, trends and workflows |
For the foundational definition, read the related Yatis telematics guide in resources. This article intentionally goes deeper into the technical data flow.
Frequently Asked Questions About How Fleet Telematics Works
Conclusion: From Signals to Decisions
Fleet telematics works as a connected data pipeline: vehicle signals are collected at the edge, transmitted through connectivity, received and processed in the cloud, interpreted by analytics and rules, and delivered through alerts, APIs and dashboards where teams can act.
When evaluated layer by layer — vehicle, device, connectivity, ingestion, analytics, alerts, APIs, dashboard and action — fleet managers can see beyond the map marker and choose a system that turns everyday vehicle data into reliable fleet intelligence.
See the Full Picture Behind Every Vehicle
Discover how the Yatis telematics platform connects vehicle sensors, GPS, devices, connectivity and cloud analytics into live dashboards, actionable alerts and integrations that help your fleet operate with confidence.
Get Started Today →