

Driver Behaviour Monitoring: 12 Telematics Metrics That Matter

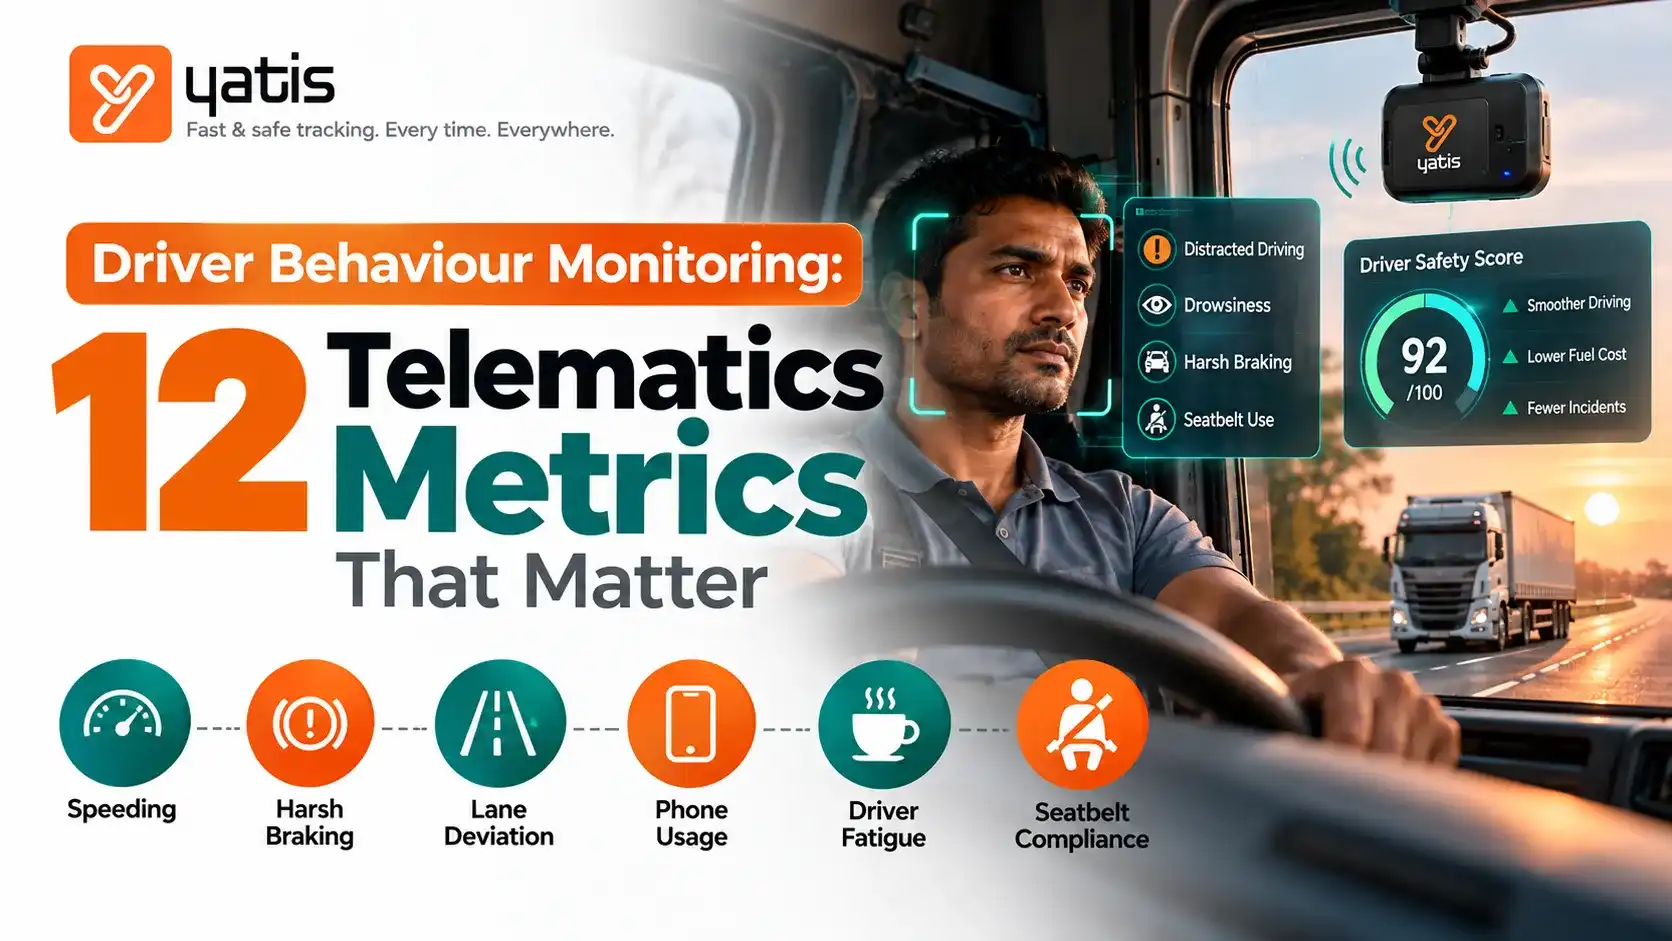
A practical framework for measuring risky driving, building a driver score, setting useful thresholds, coaching drivers and turning telematics data into a repeatable fleet safety programme.
From Event Data to Safer Driving
01. Detect
Capture speeding, braking and safety events.
02. Measure
Convert events into comparable metrics.
03. Score
Combine events into a consistent signal.
04. Coach
Discuss context and agree behaviour change.
05. Improve
Re-measure the event rate over time.
What Is Driver Behaviour Monitoring?
Driver behaviour monitoring is the process of collecting and analysing vehicle and driving-event data to understand how vehicles are being operated. Depending on hardware and configuration, telematics may identify speeding, harsh braking, rapid acceleration, excessive idling, sharp cornering and other events. Video telematics can add visual context to selected incidents.
The important distinction is between event detection and behaviour management. A dashboard can tell you that a harsh-braking event occurred. A mature safety programme asks how often it happens, where it happens, whether the threshold is appropriate, whether the pattern is recurring and what coaching action should follow.
Yatis identifies driver behaviour monitoring within its GPS platform and lists supported events such as harsh braking, overspeeding and unsafe driving. Yatis GPS Tracking System · GPS Tracking for Driver Safety.
12 Driver Behaviour Monitoring Metrics That Matter
Rather than counting every alert equally, group metrics around the safety decisions your fleet team actually needs to make.
01. Speeding
Frequency and duration of driving above the defined speed threshold.
02. Harsh Braking
Sudden deceleration events above the configured threshold.
03. Harsh Acceleration
Rapid acceleration events that may indicate aggressive driving.
04. Harsh Cornering
Sharp lateral manoeuvres detected above the configured threshold.
05. Excessive Idling
Engine-on time without productive movement.
06. Seat-Belt Compliance
Compliance events where supported by the vehicle or device.
07. Distraction / Phone Use
AI-detected distraction events where supported by video telematics.
08. Following-Distance Risk
Unsafe following events where supported by an appropriate camera/AI system.
09. Fatigue / Drowsiness
AI-detected fatigue indicators where supported; signals for review, not medical diagnoses.
10. Collision / Impact Events
Detected impacts or crash-related events requiring investigation.
11. Route & Policy Compliance
Unauthorised use, route deviations or other configured policy exceptions.
12. Repeat-Risk Frequency
Recurring safety events per unit of exposure over time.
Metrics 1–5: Core Driving Events
1. Speeding
Track the number of speeding events, total speeding duration, maximum recorded speed and speeding exposure. Compare events with distance or driving hours rather than relying only on raw counts.
Decision: Identify where and how often speed thresholds are exceeded.
2. Harsh Braking
Harsh braking measures sudden deceleration beyond a configured threshold. Interpret events in context because congestion, pedestrians and unexpected road conditions can create legitimate hard-braking events.
Decision: Separate recurring patterns from justified one-off events.
3. Harsh Acceleration
Rapid acceleration can indicate aggressive driving and may contribute to fuel consumption and drivetrain wear. Track events relative to distance or driving hours.
Decision: Coach aggressive acceleration patterns with exposure-normalised data.
4. Harsh Cornering
Sharp cornering measures lateral driving behaviour. Thresholds should account for vehicle type and operating environment.
Decision: Calibrate thresholds for vehicle class and route type.
5. Excessive Idling
Measure idle duration, idle events and idle ratio. Review locations and time-of-day patterns to distinguish operationally necessary idling from avoidable engine-on time.
Decision: Distinguish necessary idling from avoidable engine-on time.
Metrics 6–10: Compliance, AI and Incident Context
6. Seat-Belt Compliance
Where supported by vehicle or device data, report compliance percentage and recurring exceptions rather than treating one isolated event as representative of overall behaviour.
Decision: Focus on recurring exceptions, not isolated events.
7. Distraction and Phone Use
AI video telematics can detect selected distraction or phone-use behaviours. Review relevant footage and system context rather than treating detection as infallible. Yatis AI Dash Cams describe driver behaviour coaching and AI-detected events.
Decision: Pair AI detections with video review before coaching.
8. Following-Distance Risk
Where supported, following-distance alerts can identify recurring close-following patterns. Pair this metric with video context and coaching.
Decision: Target recurring close-following behaviour with evidence.
9. Fatigue and Drowsiness Signals
Some AI systems detect indicators associated with fatigue or drowsiness. Treat these as operational signals requiring review, not medical conclusions.
Decision: Review fatigue signals promptly and adjust scheduling where needed.
10. Collision and Impact Events
Use impact alerts to trigger a structured investigation: preserve relevant footage, review GPS and speed context, record the incident and identify follow-up actions. See the Yatis fleet accident investigation workflow.
Decision: Investigate every impact with data and footage preserved.
Metrics 11–12: Policy and Repeat-Risk
11. Route and Policy Compliance
Relevant indicators can include unauthorised use, after-hours movement, route deviation and configured geofence exceptions. The Yatis GPS Tracking System supports route history, geofencing, alerts and driver behaviour insights.
Decision: Enforce route and usage policy consistently.
12. Repeat-Risk Frequency
Track events per 100 km or per 10 driving hours and examine whether the rate is rising or falling. Yatis' analytics guidance illustrates tracking driver events over successive weeks to assess whether intervention is producing improvement. See GPS Tracking Data Analytics.
Decision: Track whether coaching is actually reducing risk over time.
How to Build a Driver Safety Score
A driver score converts multiple event types into a consistent management signal. The exact weights should be defined by the fleet's safety policy, vehicle type, operating environment and available data.
| Event | Illustrative weight | Reason |
|---|---|---|
| Severe speeding | 5 points/event | Potentially high-risk speed behaviour. |
| Harsh braking | 3 points/event | Sudden deceleration pattern. |
| Harsh acceleration | 2 points/event | Aggressive acceleration pattern. |
| Harsh cornering | 2 points/event | Potentially aggressive manoeuvring. |
| Excessive idling | 1 point/event | Operational inefficiency; safety relevance depends on context. |
Illustrative only — not an industry-standard scoring system.
Why Exposure-Normalised Metrics Matter
Raw event counts can mislead because drivers travel different distances and routes.
Setting Driver Behaviour Thresholds
Thresholds determine which events your system flags. Poorly set thresholds create false positives or miss real risk.
| Principle | Practical approach |
|---|---|
| Vehicle-specific | Consider vehicle class, weight and dynamics. |
| Road-specific | Use appropriate rules for highways, cities and restricted zones. |
| Severity-aware | Separate minor events from severe or repeated events. |
| Exposure-aware | Compare rates per km or driving hour where appropriate. |
| Trend-aware | Look at recurring patterns rather than one-off exceptions. |
| Reviewable | Audit thresholds periodically to reduce false positives and missed events. |
From Alerts to Driver Coaching
Alerts become useful when they feed a repeatable coaching workflow.
1. Detect
Identify the event or recurring pattern.
2. Validate
Review GPS, route, vehicle and video context.
3. Discuss
Give the driver an opportunity to explain.
4. Coach
Agree on a specific behaviour change.
5. Re-measure
Track the event rate after coaching.
- Detect: Identify the event or recurring pattern.
- Validate: Review GPS, route, vehicle and video context where available.
- Discuss: Give the driver an opportunity to explain.
- Coach: Agree on a specific behaviour change.
- Re-measure: Track the event rate after coaching.
Yatis' driver-coaching guidance positions video telematics as a way to create objective, context-supported coaching conversations. Read the Yatis driver coaching guide.
Should Fleets Use Incentives?
Incentives can be part of a safety programme, but criteria should be transparent and should not encourage drivers to avoid detection rather than improve safety. Consider combining safety-event trends with compliance, training completion and documented improvement.
Driver Behaviour Reporting: What Should the Dashboard Show?
A good dashboard should answer what is happening, why it is happening and what needs coaching action.
| Dashboard area | Recommended fields |
|---|---|
| Driver score | Current score, previous period, change and methodology. |
| Risk events | Speeding, braking, acceleration, cornering and other supported events. |
| Exposure | Km, driving hours and event rate. |
| Trend | Week-on-week or month-on-month event rate. |
| Coaching | Coaching date, topic, owner and follow-up result. |
| Video evidence | Linked clips for relevant AI-detected events where available. |
| Fleet view | Aggregated trends by depot, route, vehicle type and time period. |
Driver Safety Scorecard — Linkable Asset
A practical Driver Safety Scorecard should combine exposure-normalised events, score, trend and coaching status.
| Driver | KM | Speeding/100km | Braking/100km | Accel./100km | Cornering/100km | Idle % | Score | Coaching |
|---|---|---|---|---|---|---|---|---|
| Driver A | 4,200 | 0.8 | 0.5 | 0.4 | 0.2 | 4.1% | Illustrative | Completed |
| Driver B | 3,600 | 2.4 | 1.7 | 1.2 | 0.9 | 7.8% | Illustrative | Required |
Example values are illustrative and are not industry benchmarks or a Yatis scoring standard.
Driver Behaviour Monitoring and AI Dash Cams
GPS telematics is useful for movement, speed, distance and supported vehicle events. AI dash cams can add visual context for selected driver and road events.
Yatis' AI Dash Cam solution describes live HD video, real-time risk alerts, driver behaviour coaching, GPS-backed incident detection and cloud upload of critical events. Explore Yatis AI Dash Cams.
Creating a Safety Culture, Not Just a Score
A driver score is a measurement tool. A safety culture is the system around it: clear expectations, transparent definitions, appropriate thresholds, consistent coaching, contextual review, recognition of improvement and secure handling of driver/video data.
Yatis' fleet-video guidance discusses retention policies, secure cloud storage, role-based access and transparent communication around video telematics data. Read the fleet video data and privacy guide.
Common Driver Behaviour Monitoring Mistakes
1. Ranking drivers using raw event counts
Drivers travel different distances and routes. Exposure-normalised metrics are often more informative.
2. Treating every alert as equally serious
Severity, context and recurrence matter.
3. Using one threshold for every vehicle
Vehicle type and operating conditions can affect event detection.
4. Coaching without measuring follow-up
The programme should show whether event rates change after intervention.
5. Treating AI detection as infallible
AI-detected events should be reviewed within system capability and available evidence.
6. Using scores only for punishment
A score is more useful when it supports learning, coaching, accountability and measurable improvement.
Conclusion
Effective driver behaviour monitoring is not about collecting the largest number of alerts. It is about turning reliable event data into measurable behaviour change.
Start with speeding, harsh braking, acceleration, cornering and idling. Add compliance and AI-video metrics where supported. Normalise events by exposure, calibrate thresholds, validate context, coach consistently and track improvement over time.
External Sources & Further Reading
External references provide general road-safety context; they are not used as universal driver-score benchmarks.
Frequently Asked Questions About Driver Behaviour Monitoring
Turn Driver Data Into Safer Driving
Start measuring driver behaviour with Yatis telematics — track speeding, harsh braking, acceleration, idling and safety events, then coach drivers with objective data and video context.
Get Started Today →